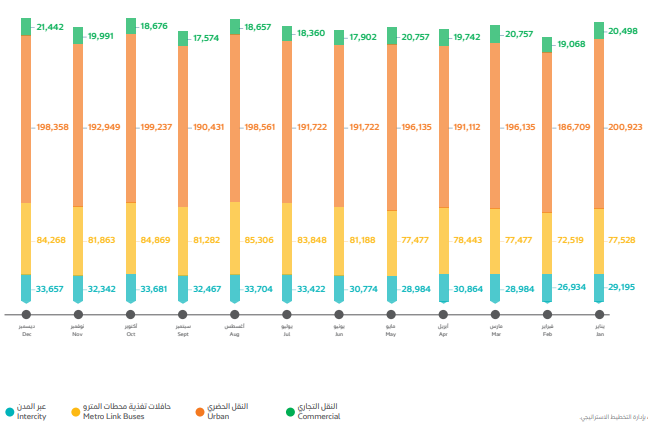
Personal vehicles are most widely used in the UAE since their number increased from 13.329 in 2015 to 13.594 in 2016 (“Annual statistical report 2014 – 2016,” 2017) compared to the public transportation fleet comprised of 1512 buses in 2016. Figure 1 contains data on bus ridership per purpose and provides background information regarding the economic and social value of bus services.
As for the level of accidents, personal vehicles take the first position (Figure 2) (“Bus transportation,” n.d; “RTA extends operation,” 2017; Shahbandari, 2015; Worku, 2013). Some other transportation types are studied as well (Holmgren, 2013; Kemp & Stephani, 2013; Tirachini, 2013; Qiu, Li, Zhang, Zhang, & Xie, 2015; Wirasinghe et al., 2013).
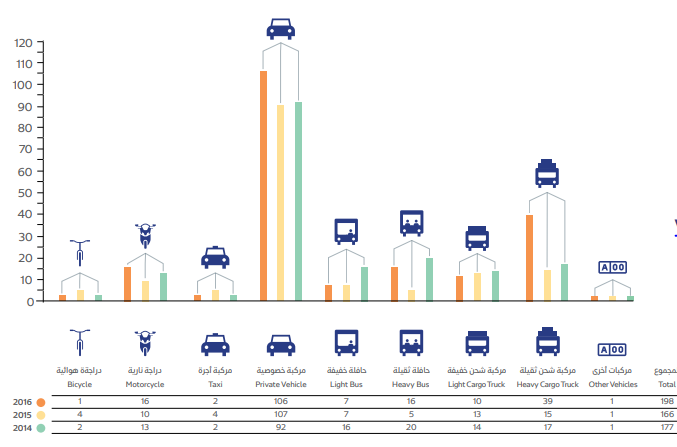
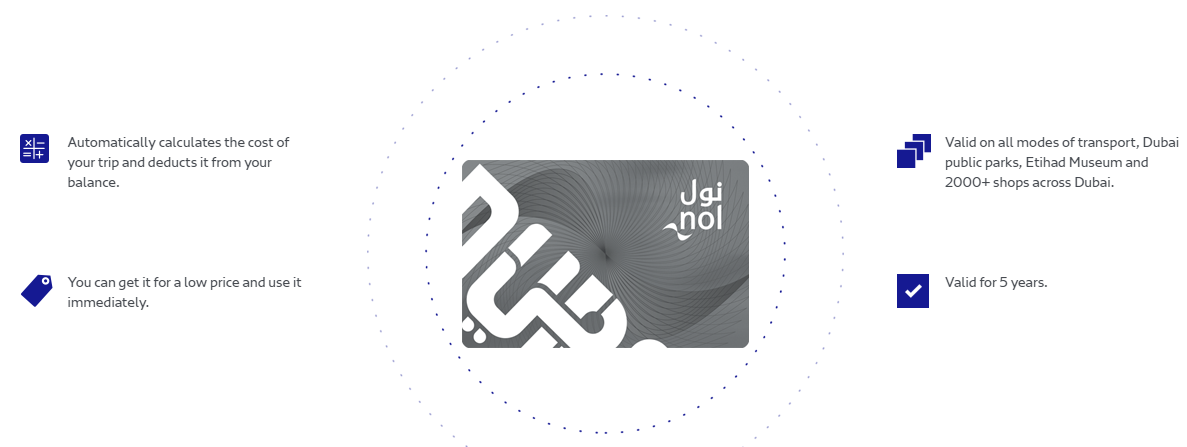
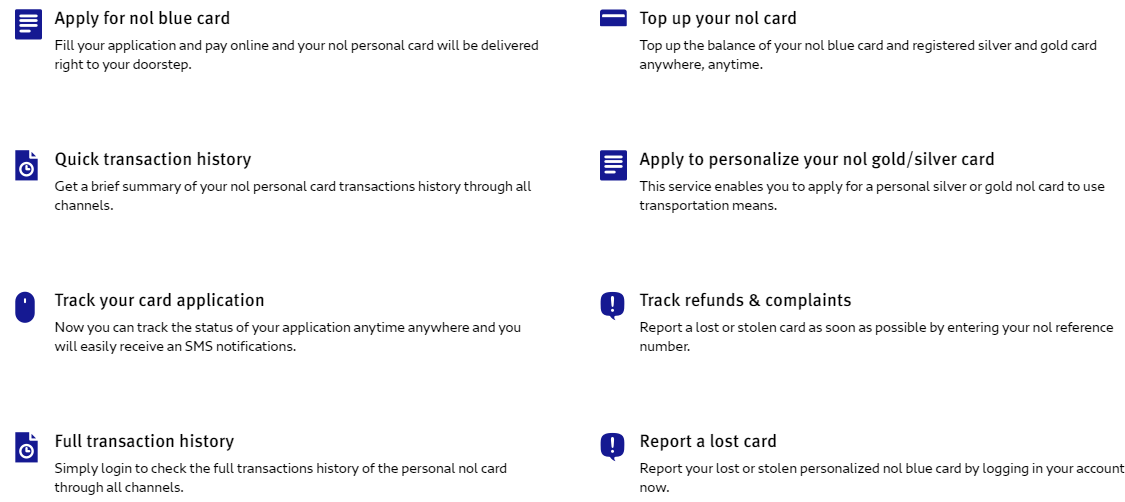
The data on accidents is employed to research and formulate recommendations for encouraging public transportation use among affluent Abu Dhabi residents. Since the rate of bus accidents is significantly low compared to private automobiles, this information may be used to address users’ safety concerns. Additionally, the data provided on Figures 4 and 5 − Benefits of the proposed Nol card system − is used to identify advantages associated with the electronic ticketing system, which can potentially attract the targeted population to public transportation services.
The study conducted by Road Safety UAE shows the levels of road safety monitoring based on the answers of respondents (Table 1) and implies that sustainable development is the key goal in the transportation of the UAE (Ahmed, 2017; Anderson, 2014; Asimet al. 2014; El-Bana, Selim, & Taleb, 2015; Gentile & Noekel, 2016; Goodwin & Van Dende, 2013; Kang, Khodadadifard, & Afandizadeh, 2017).
Table 1: UAE road safety monitoring (“Statistics,” 2017).
The comparison of frequency percentages represented in the table above is performed by using the Pearson correlation coefficient, which allows detecting attitude patterns among respondents in different periods. The information is used to address such specific study objectives as the specification of factors that need to be considered while implementing the project of interest, etc. Additionally, in the study the attention is paid to the target population, affluent Abu Dhabi citizens, focusing on their income, preferences, etc.
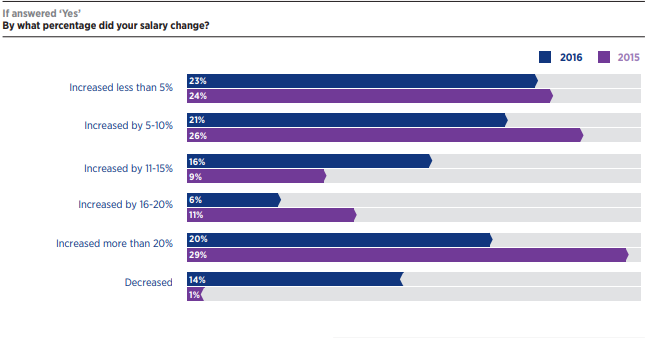
According to the estimates of the Household Income and Expenditure Survey (HIES), the average salary for people with high-income ranges from 40,000 to 200,000 AED (“About HIES,” 2013). In general, various industries show an increase in salary levels. For example, Figure 5 represents the accounting and finance employee survey highlights for UAE employees.
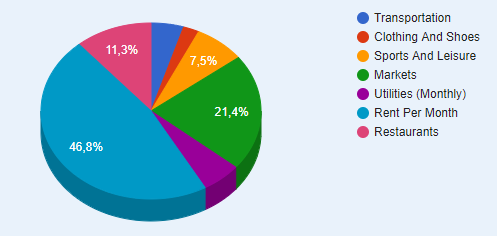
Reviewing Figures 6 and 7, one may observe the average spending on transportation and other necessary items in Abu Dhabi.

Geographic information systems (GIS) data is used to identify the required length and other specifics of a dedicated bus lane and determine how road traffic is regulated to ensure the effectiveness of a new system (Daraio et al., 2016; deOña, de Oña, Eboli, & Mazzulla, 2013; Hassan, Hawas, & Ahmed, 2013; Parahoo, Harvey, & Radi, 2014; Redman, Friman, Gärling, & Hartig, 2013; Xenias & Whitmarsh, 2013). The quantitative method with the use of the linear regression allows examining the links between distinct covariates (e.g., lane length, Nol card system use, etc.) and a numeric outcome (i.e., cost efficiency and social effectiveness of transportation service).
The comparison of data on Dubai’s several existing dedicated bus lanes (e.g., located on Al Ghubaiba road, “about 320 meter from Al Mina Intersection up to Street 12”) and Nol card system functions helps reveal the relationship between suggested covariates and expected outcomes (Government of Dubai, 2017, para. 1; “A better efficiency”, 2014; Bajracharya, 2016; Chakravarty & Qamhaieh, 2015; Guo, 2013; Henderson, 2014; Innocenti, Lattarulo, & Pazienza, 2013; Khoo, Teoh, & Meng, 2014; Misra, 2016; Shahbandari, 2015; Zambonini & Zafar, 2014). Considering the specific Abu Dhabi road issues and the purpose of a dedicated bus lane, it will be important to analyze more data (Ma, Head, & Feng, 2014; Sbia, Shahbaz, & Hamdi, 2014; Şimşekoğlu, Nordfjærn, & Rundmo, 2015). After data analysis phase, it is expected to provide valuable recommendations for further implementation of the proposed innovations.
Table 2: Multi-stakeholder matrix.
References
A better efficiency for public transportation systems with the use of contactless payments. (2014). Web.
About HIES. (2013). Web.
Ahmed, K. G. (2017). Designing sustainable urban social housing in the United Arab Emirates. Sustainability, 9(8), 1413-1428.
Anderson, M. L. (2014). Subways, strikes, and slowdowns: The impacts of public transit on traffic congestion. American Economic Review, 104(9), 2763-2796.
Asim, M., El-Menyar, A., Al-Thani, H., Abdelrahman, H., Zarour, A., & Latifi, R. (2014). Blunt traumatic injury in the Arab Middle Eastern populations. Journal of Emergencies, Trauma, and Shock, 7(2), 88-96.
Bajracharya, A. (2016). Public transportation and private car: A system dynamics approach in understanding the mode choice. International Journal of System Dynamics Applications, 5(2), 1-18.
Bus transportation. (n.d.). Web.
Chakravarty, S., & Qamhaieh, A. (2015). Global gentrifications: Uneven development and displacement. Bristol, YK: Policy Press.
Cost of living comparison between Dubai and Abu Dhabi. (2018). Web.
Daraio, C., Diana, M., Di Costa, F., Leporelli, C., Matteucci, G., & Nastasi, A. (2016). Efficiency and effectiveness in the urban public transport sector: A critical review with directions for future research. European Journal of Operational Research, 248(1), 1-20.
deOña, J., de Oña, R., Eboli, L., & Mazzulla, G. (2013). Perceived service quality in bus transit service: A structural equation approach. Transport Policy, 29(1), 219-226.
El-Bana, N., Selim, S. E., & Taleb, H. (2015). Optimising sustainability at an urban level: A case study of Dubai sustainable city. WIT Transactions on Ecology and the Environment, 193(1), 985-995.
Gentile, G., & Noekel, K. (2016). Modelling public transport passenger flows in the era of intelligent transport systems. New York, NY: Springer.
Goodwin, P., & Van Dender, K. (2013). ‘Peak car’—themes and issues. Transport Reviews, 33(3), 243-254.
Government of Dubai. (2017). Bus lanes. Web.
Guo, Z. (2013). Residential street parking and car ownership: A study of households with off-street parking in the New York City region. Journal of the American Planning Association, 79(1), 32-48.
Hassan, M. N., Hawas, Y. E., & Ahmed, K. (2013). A multi-dimensional framework for evaluating the transit service performance. Transportation Research Part A: Policy and Practice, 50(1), 47-61.
Henderson, J. C. (2014). Global Gulf cities and tourism: A review of Abu Dhabi, Doha and Dubai. Tourism Recreation Research, 39(1), 107-114.
Holmgren, J. (2013). An analysis of the determinants of local public transport demand focusing the effects of income changes. European Transport Research Review, 5(2), 101-107.
Innocenti, A., Lattarulo, P., & Pazienza, M. G. (2013). Car stickiness: Heuristics and biases in travel choice. Transport Policy, 25, 158-168.
Kang, M. J., Khodadadifard, M., & Afandizadeh, S. (2017). Providing a decision-making method for evaluation of exclusive BRT lanes implementation using benefit-cost analysis–case study: Tehran BRT line 4. Journal of Civil Engineering and Materials Application, 1(1), 8-15.
Kemp, R. L., & Stephani, C. J. (Eds.). (2013). Urban transportation innovations worldwide: Best practices outside the United States. Jefferson, NC: McFarland.
Khoo, H. L., Teoh, L. E., & Meng, Q. (2014). A bi-objective optimization approach for exclusive bus lane selection and scheduling design. Engineering Optimization, 46(7), 987-1007.
Ma, W., Head, K. L., & Feng, Y. (2014). Integrated optimization of transit priority operation at isolated intersections: A person-capacity-based approach. Transportation Research Part C: Emerging Technologies, 40(1), 49-62.
Misra, T. (2016). Why did bus rapid transit go bust in Delhi? Web.
Nol cards. (2017). Web.
Parahoo, S. K., Harvey, H. L., & Radi, G. Y. A. (2014). Satisfaction of tourists with public transport: An empirical investigation in Dubai. Journal of Travel & Tourism Marketing, 31(8), 1004-1017.
Qiu, F., Li, W., Zhang, J., Zhang, X., & Xie, Q. (2015). Exploring suitable traffic conditions for intermittent bus lanes. Journal of Advanced Transportation, 49(3), 309-325.
Redman, L., Friman, M., Gärling, T., & Hartig, T. (2013). Quality attributes of public transport that attract car users: A research review. Transport Policy, 25(1), 119-127.
RTA extends operation of smart vehicle in Business Bay to Feb 22nd in coop with Dubai Properties.(2017). Web.
Salary and employment report 2017. (2017). Web.
Sbia, R., Shahbaz, M., & Hamdi, H. (2014). A contribution of foreign direct investment, clean energy, trade openness, carbon emissions and economic growth to energy demand in UAE. Economic Modelling, 36, 191-197.
Shahbandari, S. (2015). For every two Dubai residents, there is one car. Web.
Şimşekoğlu, Ö.,Nordfjærn, T., & Rundmo, T. (2015). The role of attitudes, transport priorities, and car use habit for travel mode use and intentions to use public transportation in an urban Norwegian public. Transport Policy, 42(2), 113-120.
Statistics. (2017). Web.
Tirachini, A. (2013). Estimation of travel time and the benefits of upgrading the fare payment technology in urban bus services. Transportation Research Part C: Emerging Technologies, 30(2), 239-256.
Wirasinghe, S. C., Kattan, L., Rahman, M. M., Hubbell, J., Thilakaratne, R., & Anowar, S. (2013). Bus rapid transit–a review. International Journal of Urban Sciences, 17(1), 1-31.
Worku, G. B. (2013). Demand for improved public transport services in the UAE: A contingent valuation study in Dubai. International Journal of Business and Management, 8(10), 108-125.
Xenias, D., & Whitmarsh, L. (2013). Dimensions and determinants of expert and public attitudes to sustainable transport policies and technologies. Transportation Research Part A: Policy and Practice, 48(2), 75-85.
Zambonini, P., & Zafar, S. (2014). Mobile payment innovation in the Arabian Gulf. Journal of Payments Strategy & Systems, 8(3), 307-315.