Introduction
Purchasing power parity (PPP) theory is an integral economic theory, which predicts exchange rates of currencies in a country based on the inflation rates using a regression model. The theory postulates that when inflation rate of a country increases, there is a decrease in exports and an increase in imports, resulting in high exchange rates between two countries. With the use of a regression model, it is possible to assess the validity of the theory in predicting the relationship between exchange rates and differential inflation rates over a period.
To apply the theory, the project selected two countries, namely, the United States and Malaysia, and retrieved historical data of annual inflation rates and annual exchange rates from 1970 to 2016. The project obtained data of annual inflation rates from the World Bank (2017a) and data of annual exchange rates from the World Bank (2017b). Therefore, this project predicts the influence of the annual difference in inflation rates on annual exchange rates using the regression model and compared obtained β0 and β1 values with the ones of the PPP model.
Regression Model Used
The project used the following regression model in predicting the influence of the difference in annual inflation rates on annual exchange rates.
Where β0 is the y-intercept, β1 is the gradient, and 6 is the error term.
Regression Outcomes
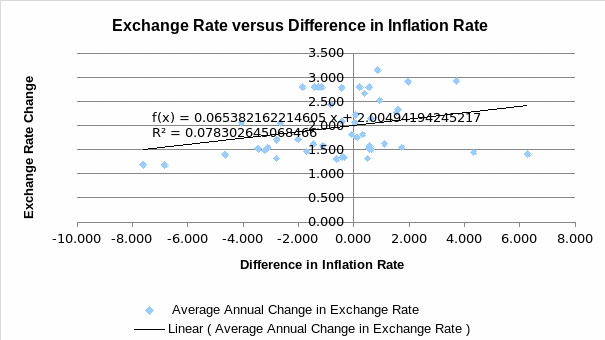
Table 1 below is a regression model showing the strength of relationship between annual exchange rates and annual inflation rates, and the degree of prediction. The regression model shows that there is a weak relationship between annual exchange rates and the difference in annual inflation rates of Malaysia and the United States (R =0.28). R-square reveals that annual exchange rates account for 7.8% of the variation in the difference in annual inflation rates (R2 = 0.078).
Table 1.
The ANOVA table (Table 2) indicates that the regression model is statistically insignificant in predicting the influence of annual exchange rates on the difference in annual inflation rates, F(1,45) = 3.822, p = 0.057.
Table 2.
Coefficients’ table (Table 3) shows that annual exchange rate is a predictor, which is statistically insignificant in predicting the difference in inflation rates between the United States and Malaysia (p = 0.057).
Table 3.
Equation of the Regression Model
Testing of the PPP Theory
Graphical Test
The graphical test provides a visual and conceptual way of testing the PPP theory using empirical data. Figure 1 is a scatterplot depicting the relationship between annual exchange rate and the difference in inflation rates for Malaysia and the United States. The scatter plot shows that there is apparent deviation of data points and trend line from the PPP line. The deviation implies that the PPP theory does not hold in explaining the variation of exchange rates based on trends of inflation rates from 1970 to 2016. According to Baumol and Blinder (2015), a graphical depiction of relationships between exchange rates and the difference in inflation rates shows if data points differ considerably from the trend line of the PPP model.

Statistical Test
Regression model shows that coefficient of β0 = 2.005 while the coefficient of β1 = 0.065. The t-test aims to determine if the coefficients of the regression model differ significantly from the coefficient of the PPP model, which has β0 of zero and β1 of one. Madura (2016) explains that coefficients of the regression model and their respective standard errors are values used in the t-test analysis to determine the significance of the difference from the hypothesized values of the PPP model.
At β0 = 0, t =β0 – 0/ SE = 2.005-0/0.085 = 23.588.
At β1 = 1, t = β1 -1/SE = 0.065 -1/0.033 = -28.33.
Therefore, the t-test rejects the null hypothesis that the coefficients of the regression model are equal to those of the PPP model. In this view, the PPP model is not applicable in predicting inflation of Malaysia based on the trends of the exchange rate of the foreign.
Conclusion
Comparison of the findings and the PPP model shows that there are marked differences in trends as demonstrated by the scatterplot and the statistical test. The findings mean that the PPP model does not hold in predicting the relationship between the annual exchange rates and the annual difference in inflation rates. Suggestively, confounders could have mediated the relationship between the exchange range and the difference in the inflation rate, resulting in observed deviation from the PPP model.
References
Baumol, W., & Blinder, A. (2015). Economics: Principles and policy. New York, NY: Cengage Learning
Madura, J. (2016). International financial management. New York, NY: Cengage Learning.
World Bank. (2017a). Inflation, consumer prices (annual %). Web.
World Bank. (2017b). Official exchange rate (LCU per US$, period average). Web.