Introduction
International universities are mainly established with a view of providing higher education services to students who wish to pursue their studies at the bachelor’s level, master’s, or even PhD level. These universities offer quality research in various aspects of education, which in turn provides knowledge and important insights into varied areas of academia and day to day life.
International universities appeal to students from all over the world, without restricting on countries of origin or continents. It is the quality of services and high performance available in these institutions that market the universities to far off countries where students have no access to such quality education.
These universities, in preparing their students for the professional challenges that await them, often collaborate with organisations and research institutions, such as hospitals or medicine manufacturing firms, in order to provide their students with first-hand real-life experience, which might not be available in their home countries.
Customer Satisfaction
Stakeholders
Methods for Capturing Customer Needs
Interviewing customers
The institution can use interviewing method to seek customers’ views and ideas on its general performance and productivity. The interviews can be conducted on a face-to-face basis, where a representative of the university can meet the students, who are the customers, and seek to obtain their views concerning the university.
Equally, phone interviews can be utilized, whereby the interviewer from the institution obtains phone contacts of several students or prospective students and reaches them on phone. Responses given are recorded carefully and accurately against each question raised in order to have the right communication.
Alternatively, mail interviews can also be used, especially where customers are located in a far place. The postal address of the customer is obtained, and a set of questions dispatched to him or her. The customer will eventually mail his answers after entering the details as required (Thorsten et al. 2008, p. 400).
Customer survey
Customer surveys are effectively conducted by the representatives of the institution who conduct the survey amongst the institution’s customers. Various tools are needed in the survey, including pre-printed questionnaires, which can be distributed to clients for filling.
The questionnaires should have questions designed in such a way that they seek to determine from the customers what their needs and expectations are, and how the institution could improve on its service delivery. Answers to these questions could be either in the form of multiple choices, or requiring the customers to fill in short answers.
Market study
The institution can undertake to carry out some research, mainly by observing the market trends in general. This will give a true reflection of the customer’s preferences, needs, and expectations from analysing their behaviours. If, for instance, a different university is registering very high enrolment of students than the rest, the market study would determine why this is the case.
It could be because of fair prices, quality service delivery, or generally improved performance. Market study is often done by use of observation method, where the phenomenon is observed, and patterns and trends carefully noted.
Contacting customers via electronic mail
Email can be used to contact customers and establish what their actual preferences and needs are. The email is a remarkably flexible and highly interactive channel of communication which can be relied upon by the management of the institution due to its speed in terms of performance. Electronic mails are particularly efficient because they eliminate the influence aspect of the questioner that is common in direct interviews.
Usage statistics
Usage statistics give information on whether customers are acknowledging the product or service, or whether they have particular resentments. When the volume of students enrolling at the university gradually increases, it is evident that customers are finding all their needs being met at the institution.
On the contrary, when the enrolment numbers indicate a decrease over time, it indicates that customers are not fully satisfied with the institution’s services and performance and could be seeking the same elsewhere.
Applying Customer Survey Using Kano Analysis
Dear customers
In an effort to improve on our general performance and service delivery of quality education continuously, we take this opportunity to invite you to participate in our customer survey exercise.
This exercise will give us a better insight into the numerous ways through which we can satisfy you as our customers and give you maximum return for choosing to work with us. Kindly, select the number that best reflects your view against each specification in the survey below.
A total of 1000 forms were used in this survey, in which case the analysis determined the following; scores between 4000 and 5000 indicate a ‘Must’ specification, while scores in the range 2000 and 3999 indicate a ‘Want’ specification.
Finally, scores lying between 1 and 1999 indicate a ‘Desirable’ specification (Shu-Ping & Ya-Hui 2011, p. 28).
KANO Analysis: Customer’s Needs
Minimum Requirements: The QFD form
FMEA Analysis
Selection and Evaluation of Supplier
The major components of international university
Among the main components that the international university will require to run its operations and services in a high quality manner include; published books for students and their instructors, internet services for doing online research, professors to instruct the students, furniture for use in lecture halls and offices, as well as security for the entire university community.
Maintenance services will be required for all the assets acquired by the institution, communication services for use by students and the administration, library services, laboratory services for enhancing research, and computer terminals to aid the online communication and research.
Computer Terminals: Criteria to be used for selecting suppliers
The criteria to be used for selecting suppliers of computer terminals to be used in the institution include the quotation price, time of delivery of the computers, the warranty duration, and their reliability in as far as performance is concerned. Other criteria include the level of customer satisfaction, their overall quality, safety measures included, the requirements, as well as the material used in design and the availability of spare parts.
Supplier Selection System
Report on supplier selection process
Three different source countries for computers were evaluated on the basis of ten different areas that directly relate to the overall performance of the computers. From the tabulated results above, the USA is the most suitable source country for the computers to be used in the institution.
Overly, the USA has a very short delivery time, has the highest performance reliability amongst the three countries, as well as a higher customer satisfaction level and safety considerations.
Although the quotation price in South Korea and Japan is better than that of the USA, the other aspects of the computers have weighed in strongly for the American supplier than both Japan and South Korea. Thus, the USA supplier has been awarded the tender to supply the computers (Sen, Sen & Baslıgil 2010, p. 1603).
Statistical Process Control
Providing knowledge to students
- Receiving application requests from students
- Choosing qualified students
- Inviting qualified students for enrolment
- Countercheck to verify their document’s authenticity
- Announcing semester commencement dates
- Reviewing curricular for the fresh year
- Communicating changes to the instructors
- Purchasing new resources required for teaching by the instructors
- Teaching students in their lecture halls
- Evaluating the performances of the students
Process Monitoring Statistical Control Charts
U-chart
U-charts are used for collecting subgroups data containing different sizes. They particularly indicate the measurement of the process by indicating nonconformities within item groups.
NP-chart
The chart is utilised for processes controlling where data with the same properties are collected as subgroups. NP-chart can also measure by words; that is, yes/no, or true/false.
C-chart
This chart collects data that are of the same size within subgroups. It conducts measurement over time where it tracks non-conforming data per item or group. C-charts are also utilised in monitoring process improving theory effects.
XMR-Chart
This chart measures stability of process as well as monitor changes within the system over time. The individual X chart can also be used for measuring.
X-bar and R-Chart
This chart is utilised in the controlling within subgroup sizes that have various processes, such as two or more. The charts indicate the process stability, and also help in making predictions. Additionally, X-bar and R-Charts can be used to show average change over the specified period of time (Gültekin et al. 2002, p. 2303).
Plotting a Control Chart
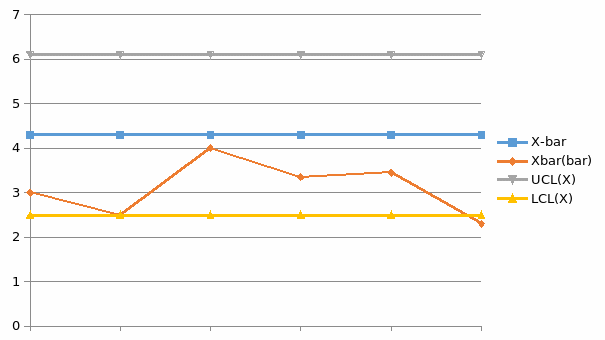
Equations applied on X-bar and R-chart; For determining X bar Upper Control Limits for X bar
UCL (X bar) = X bar(bar) + R bar * A2
For determining X bar Lower control limits
LCL (X bar) = X bar(bar) – R bar * A2
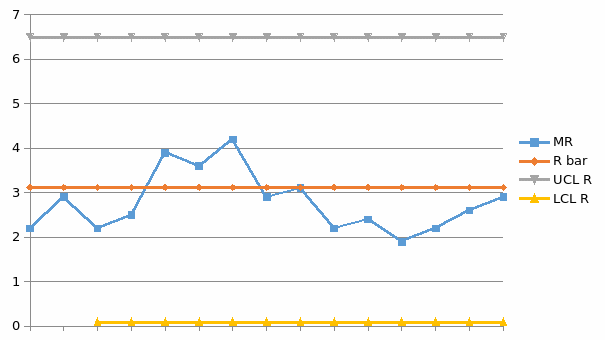
For calculating R Chart Upper and Lower control Limits;
UCL (R) = R-bar * D4 A2=0.577
LCL (R) = R-bar * D3 D4=2.089 D3=0.03
X-bar Chart

R-bar Chart

Possible Problems for Customer
Several problems could be faced by customers including increased tuition fees, disconnected internet services, longer durations in enrolling and registering every student, broken down recreational facilities, and substandard library services.
Solving the Problem
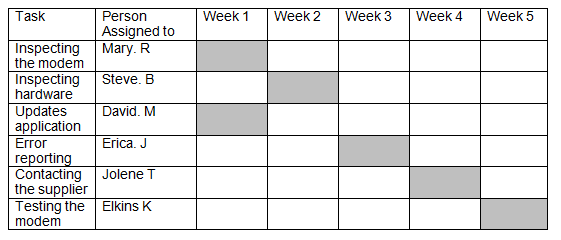
A number of problem solving tools can be used to effectively address these problems, such as brainstorming, use of check sheets, Gantt charts, pareto diagram, as well as cause and effect diagram, and use of problem solving sheet.
Problem Solving Tools Application
The above tools are used to address the difficulty experienced with the use of internet service as identified above.
Brainstorming
Brainstorming could address several related issues such as the unreliable internet speeds being caused by such reasons as failure on the part of the hardware, viruses, and old modem version. Others could be lack of inspection, as well as poor maintenance, and connection problems with the wires.
Gantt Chart

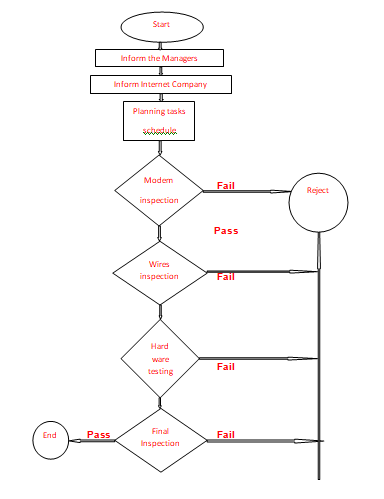
Process Flow Chart

Conclusion
Quality planning is an integral part of management which seeks to optimise on the benefits which consumers seek to obtain when they purchase a good or service. International universities are institutions which seek to sustain their exemplary performances by attracting quality students from all over the world.
These universities ensure that they have all the qualities that can support the desired quality performance, such as highly qualified instructors, education resources, efficient library facilities, as well as research institutions and centres. Students often make decisions on which institutions of higher learning they can join basing on the facilities the institutions own and their overall performance.
Student’s preferences for a particular institution of higher learning can be obtained through direct interviews, use of questionnaires, emails, and phone interviews. The preferences can be grouped into three broad categories, which include ‘must’, ‘want’, and ‘desirable’. Different statistical control charts can be used to measure and monitor data occurrences.
List of References
Brady, M, Voorhees, C, & Brusco, M 2012, ‘Service sweethearting: Its antecedents and customer consequences’, Journal of Marketing, vol 76, no 2, pp. 81-98
Gültekin, M et al 2002, ‘Monitoring automatically controlled processes using statistical control charts’, International Journal of Production Research, vol 40, no 10, pp. 2303-2320
Sen, C, Sen, S, & Baslıgil, H 2010, ‘Pre-selection of suppliers through an integrated fuzzy analytic hierarchy process and max-min methodology’, International Journal of Production Research, vol 48, no 6, pp. 1603-1625
Shu-Ping, L, & Ya-Hui, C 2011, ‘Enhancing service quality improvement strategies by integrating Kano’s model with importance-performance analysis’, International Journal of Services Technology & Management, vol 16, no 1, pp. 28-48
Thorsten, G et al 2008, ‘Revealing the expectations and preferences of complaining customers by combining the laddering interviewing technique with the Kano model of customer satisfaction’, Qualitative Market Research: An International Journal, vol 11, no 4, pp. 400-413