Quantitative approaches to research involve the systematic collection and analysis of data using descriptive and inferential statistics. In this assignment, the objective is to describe quantitative methods of inquiry and statistical analysis to establish patterns and trends in the number of discharges in various states and regions of the United States. Descriptive and inferential statistics will demonstrate that the number of discharges has decreased each year and varies among states and regions.
Methods of Inquiry
Quantitative approaches to a study entail different methods of inquiry, depending on the focus of research and the degree of variable control. According to Creswell (2014), experimental, quasi-experimental, correlational, and descriptive designs are the four quantitative methods of inquiry. The focus of the experimental method is determining the cause-effect relationship between the independent and dependent variables. Creswell (2014) notes that control, manipulation, and randomization of variables are three attributes that define the experimental method. With the attribute of control, the experimental method offers the most control of extraneous factors, which have a confounding effect on cause-effect relationships, to allow independent variables to exhibit the greatest possible effect on a dependent variable (Campbell & Stanley, 2015). Manipulation of the experimental conditions and treatments of participants permits researchers to obtain valid findings. A sampling of data entails randomization to eliminate selection biases and enhance the representation of the target population.
The quasi-experimental method of inquiry also focuses on establishing the existence of the cause-effect relationship between independent and dependent variables. This method applies in a field environment where there is minimal manipulation of experimental conditions and moderate control of variables (Allen, 2017). Researchers identify control and experimental groups and examine the cause-effect relationships of variables of interest. In comparison, correlation methods examine the strength and degree of relationship between two variables. Since this method involves observation in data collection, it does not manipulate the environmental conditions or control variables (Trochim, Donnelly, & Arora, 2016). Therefore, the lack of manipulation and control interventions prevents inference of causation. The descriptive method of inquiry focuses on investigating characteristics and attributes of variables, participants, or phenomena. Stangor (2014) holds that the descriptive method lacks both the manipulation of variables and the examination of causality. The method of data collection is mainly observation to highlight trends and patterns in the data.
The Mean, Median, and Mode of Discharges in 2014
Descriptive statistics show that the number of discharges among 31 states has a mean of 604,175.23 and median of 393,002. However, the frequency distribution shows that the number of discharges in 2014 lacks a mode because each value has a single frequency, with the lowest value being 49,564.

Comparison of Discharges in 2010, 2012, and 2015
Comparative analysis of descriptive statistics shows that the number discharges in the United States has decreased substantially. The mean number of discharges decreased from 776,667.21 (SD = 886,156) in 2010 to 645,539.11 (SD = 643,941) and 641,133.58 (SD = 616,168) in 2012 and 2015, respectively. Similarly, the median decreased from 478,025 in 2010 to 439,867.5 and 393,310 in 2012 and 2015.

The paired-samples t-test implies that the mean number of discharges in 2010 was not significantly higher than in 2015, t(27) = 1.875, p = 0.075. Field (2017) states that the test shows insignificance when the p-value is higher than the alpha level of 0.05.
Regional Comparisons in 2011
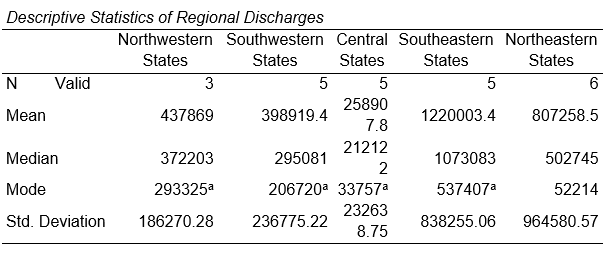
The analysis of data from 2011 shows that the southeastern states had the most discharges (M = 1,220,003.4, SD = 838,255), followed by northeastern states (M = 807,258.5, SD = 964,580), northwestern states (M = 437,869, SD = 186,270), southwestern states (M = 398,919.4, SD = 236,775), and central states (M = 258907.8, SD = 232,638).

Summary
In quantitative studies, experimental, quasi-experimental, correlational, and descriptive methods are four quantitative approaches to inquiry. The analysis of discharge data of 2014 from 31 states gives a mean of 604,175.23 and median of 393,002. Comparison of discharge data from 2010, 2012, and 2015 finds that the number of discharges decreased each time. However, the paired-samples t-test reveals that the apparent difference in the mean number of discharges between 2010 and 2015 is not statistically significant. Regional comparison of the number of discharges indicates that southeastern states had the highest number of discharges followed by northeastern, northwestern, southwestern, and central states.
References
Allen, M. (2017). The sage encyclopedia of communication research methods. Thousand Oaks, CA: SAGE Publications.
Campbell, D.T. and Stanley, J.C. (2015). Experimental and quasi-experimental designs for research. Evanston, IL: Ravenio Books.
Creswell, J. W. (2014). Research design: Qualitative, quantitative, and mixed methods approaches (4th ed.). Thousand Oaks, CA: SAGE Publications.
Field, A. P. (2017). Discovering statistics using IBM SPSS statistics (5th ed.). Thousand Oaks, CA: SAGE Publications.
Stangor, C. (2014). Research methods for the behavioral sciences. New York, NY: Cengage Learning.
Trochim, W. M. K., Donnelly, J. P., & Arora, K. (2016). Research methods: The essential knowledge base. Boston, MA: Cengage Learning.