Introduction
- The accrual-based earnings had a tendency to increase before Sarbanes-Oxley periods and decrease after, and the companies switched to using real earnings during the decline (Cohen, Dey, & Lys, 2008).
- Pre-SOX period (1987-2001) is characterized by accrual-based earnings’ and option-based compensation’s rises, and the decrease in the real earnings.
- Post-SOX period (2002-2005) had a decline in the option-based compensation and accrual-based earnings and increase in real earnings management.
Slide 1 depicts the Introduction section on pages 758-759. The accrual-based earnings had a tendency to increase before Sarbanes-Oxley periods and decrease after, and the companies switched to using real earnings during the decline (Cohen, Dey, & Lys, 2008). Pre-SOX period (1987-2001) is characterized by accrual-based earnings’ and option-based compensation’s rises, and the decrease in the real earnings. In this instance, the new options were viewed negatively, and unidentified options were discovered positively. Post-SOX period (2002-2005) had a decline in the option-based compensation and accrual-based earnings and increase in real earnings management. The firms with the managed earnings (SUSPECT) were analyzed and compared during Post- and Pre-SOX periods while associating the motives for their behavior (Cohen, Dey, & Lys, 2008).

Core Managerial Incentives
- Surpassing the financial outcomes of the precedent year.
- Monitoring the decline of the losses.
- Consensus with analysts’ forecasts.
Result
The analysis reveals that SUSPECT companies had higher discretionary accruals, but less income increasing accruals occurred after SOX.
Slide 2 depicts the introduction section on pages 758-759 with the focus on managerial incentives. The core managerial incentives are surpassing the financial outcomes of the precedent year, monitoring the decline of the losses, and consensus analysts’ forecasts. The analysis reveals that SUSPECT companies had higher discretionary accruals than the others, but less income increasing accruals occurred after SOX. This behavior can be explained by the costly implementation and inability to detect while portraying the drawbacks and advantages of the SOX Act (Cohen, Dey, & Lys, 2008).
Motivation and Hypothesis
- Purpose – evaluate the changes in functioning in the post- and pre-periods by using earnings management (Cohen, Dey, & Lys, 2008).
- The hypothesis – the managers tend to act optimistically due to 1) the alterations of earnings have a correlation with modifications in the managerial compensation, and 2) despite the control, the earnings will tend to decline due to sanctions and fraud (Cohen, Dey, & Lys, 2008).
Slide 3 discusses motivation, research questions, and hypothesis on pages 759-762. The purpose is to evaluate the changes in functioning in the post- and pre-periods by using earnings management. The hypothesis is the managers tend to act opportunistically due to 1) the alterations of earnings have a correlation with modifications in the managerial compensation, and 2) despite the control, the earnings will tend to decline due to sanctions and fraud (Cohen, Dey, & Lys, 2008).

Objectives of the Study
- Objectives:
- Monitor the levels of earnings increased during the pre-SOX and decreased in the post-SOX (Cohen, Dey, & Lys, 2008).
- Determine fluctuations in option-based compensation management in the post- and pre-times.
- Portray whether the companies replaced accrual-based earnings with real earnings after SOX (Cohen, Dey, & Lys, 2008).
Empirical Methodology
Sample
- Various tests, analysis, and approaches were based on the trusing resources.
- Compustat – 8,157 firms.
- ExecuComp – 2,018 firms.
- Timeframe – 1987-2005.
Slide 5 discusses empirical methodology: data and sample description on page 762. The sample includes the information from Compustat (8,157 firms) and ExecuComp (2,018) with all the required information such as cash flows to test the hypothesis (Cohen, Dey, & Lys, 2008). It is apparent that the required financial findings were collected within the 1987-2005 timeframe, as these matters have to comply with the chosen pre-SOX and post-SOX periods.
Events
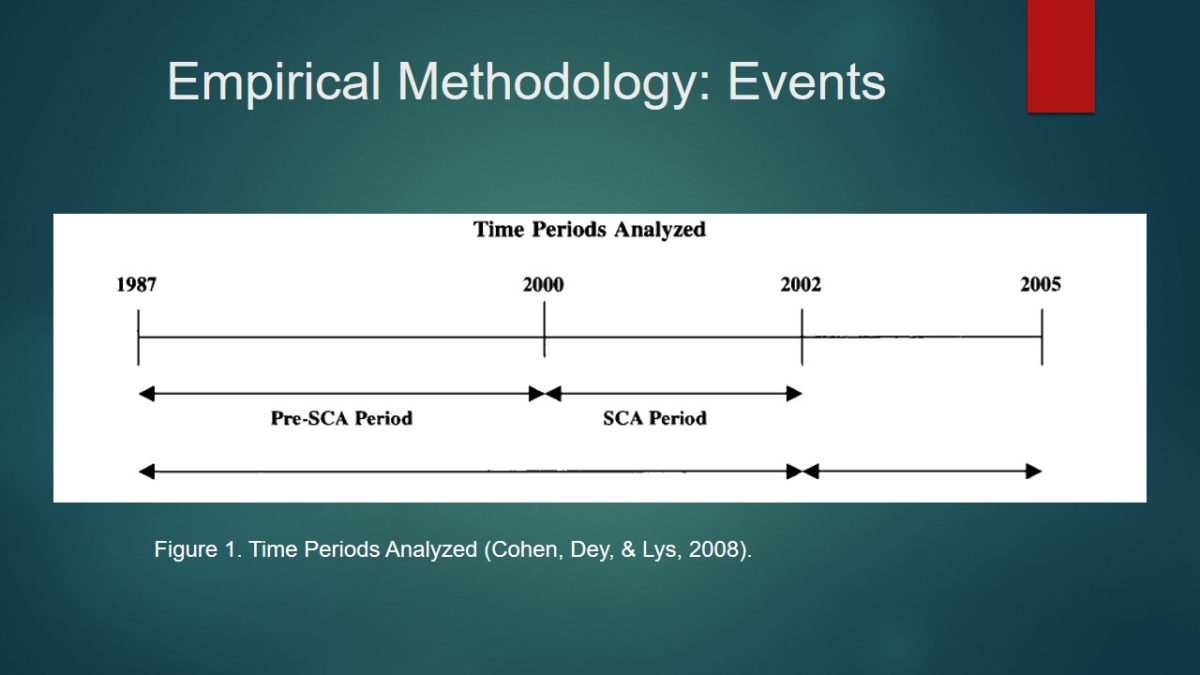
Slide 6 depicts the event periods presented on page 763. The pre-SOX period is from 1987 to 2001, and it is divided in pre-SCA (1987-1989) and SCA-period (2000-2001). Post-SOX is from 2002 to 2005 (Cohen, Dey, & Lys, 2008). In this case, figure 1 portrays the timeframe graphically.
Accrual-Based Earnings Management
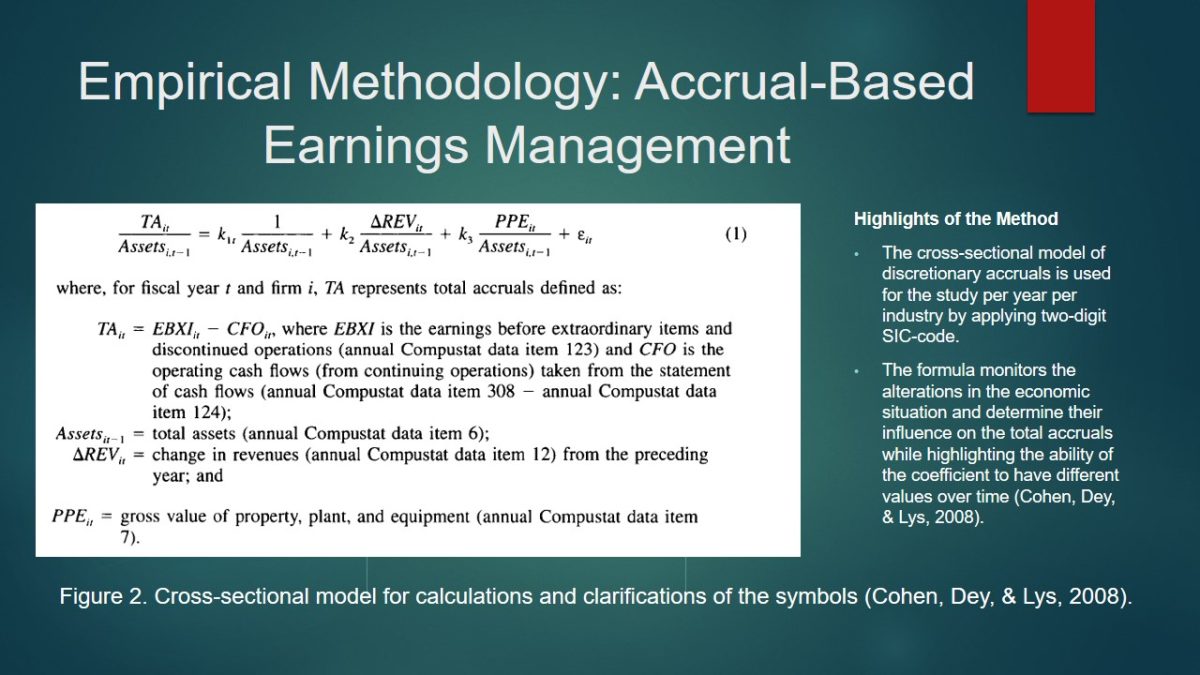
- Highlights of the Method:
- The cross-sectional model of discretionary accruals is used for the study per year per industry by applying two-digit SIC-code.
- The formula monitors the alterations in the economic situation and determine their influence on the total accruals while highlighting the ability of the coefficient to have different values over time (Cohen, Dey, & Lys, 2008).
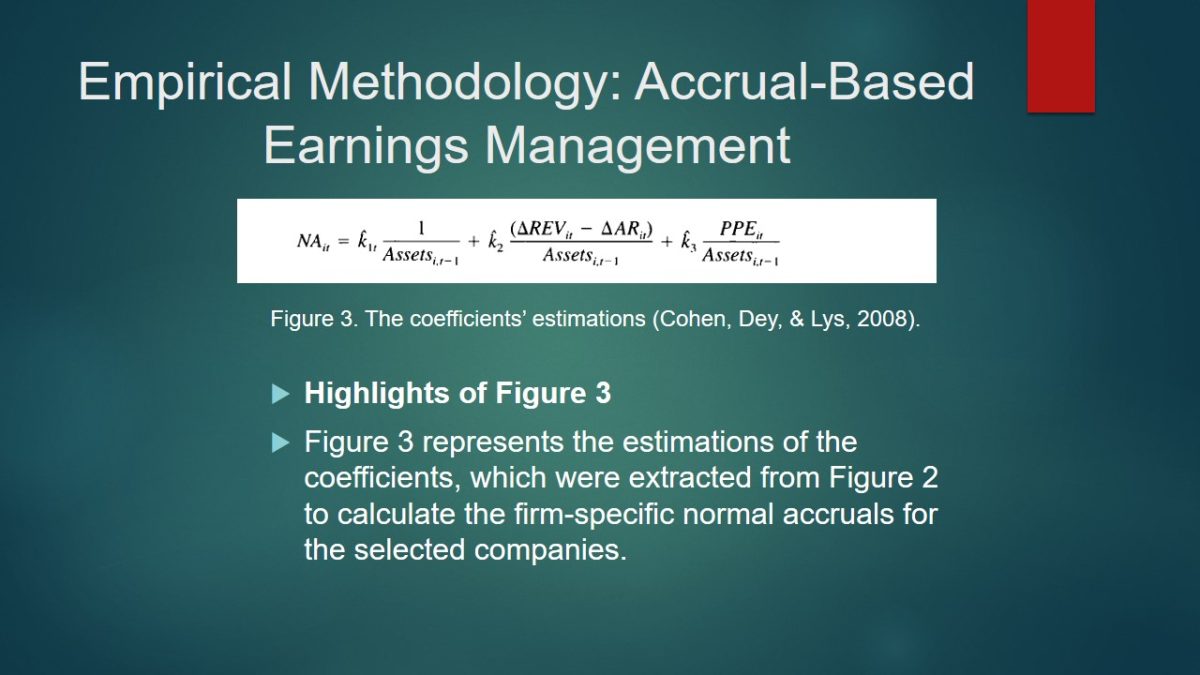
- Highlights of Figure 3:
- Figure 3 represents the estimations of the coefficients, which were extracted from Figure 2 to calculate the firm-specific normal accruals for the selected companies.
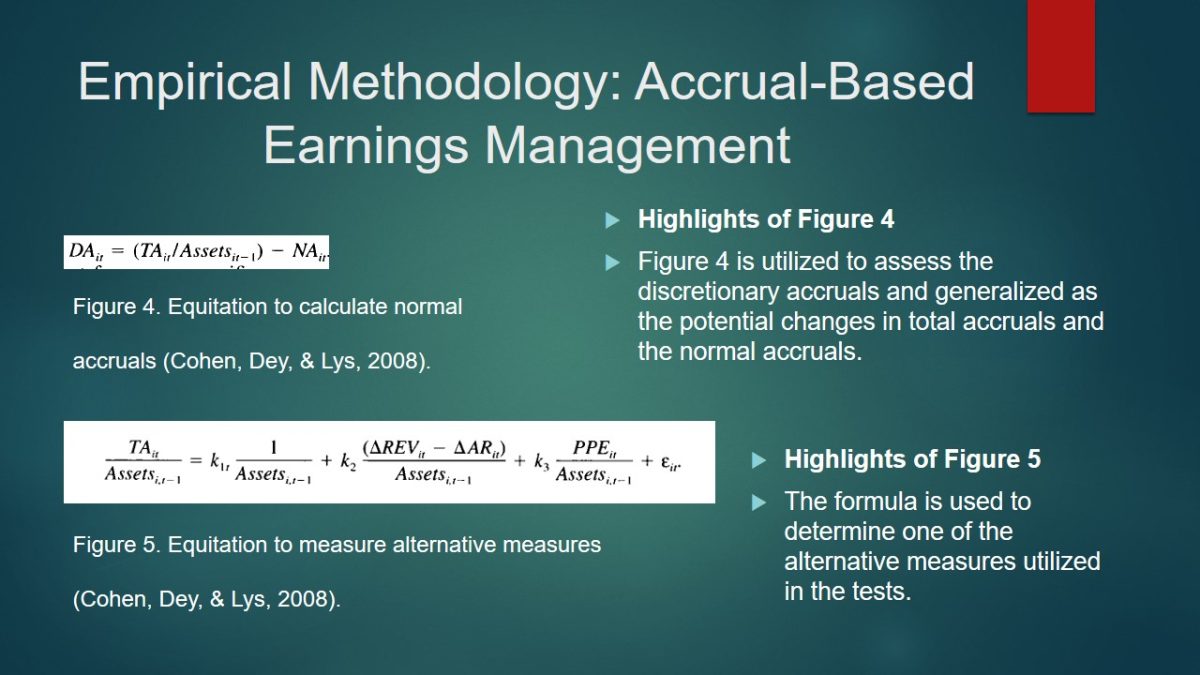
- Highlights of Figure 4:
- Figure 4 is utilized to assess the discretionary accruals and generalized as the potential changes in total accruals and the normal accruals.
- Highlights of Figure 5:
- The formula is used to determine one of the alternative measures utilized in the tests.
Slide 8 portrays the explanation of the formula on page 764, as it is vital to understand the potential aspects of the formulas’ formation. Figure 3 represents the estimations of the coefficients, which were extracted from Figure 2 to calculate the firm-specific normal accruals for the selected companies. In this instance, ARit is the fluctuations in the accounts receivables, which were acquired from Compustat data (Cohen, Dey, & Lys, 2008). In this instance, the regression in the revenues is estimated.
Slide 9 presents the formulas, which is discussed on pages 764-765. In turn, the formula, which is displayed in Figure 4 is utilized to assess the discretionary accruals and generalized as the potential changes in total accruals and the normal accruals.
The formula (Figure 5), is used to determine one of the alternative measures utilized in the tests. The level of normal accruals is calculated (percentage of total assets) is measured, then, the measure based on the performance-matched discretionary accruals is conducted (Cohen, Dey, & Lys, 2008). In turn, one company’s year observations are compared and matched with the outcomes of the identical two-digit SIC code and the year with the nearest ROA (net income/total assets).
Slide 7 explains the formula, which is presented on page 763. The cross-sectional model of discretionary accruals is used for the study per year per industry by applying two-digit SIC-code. It is apparent that the formula monitors the alterations in the economic situation and determine their influence on the total accruals while highlighting the ability of the coefficient to have different values over time (Cohen, Dey, & Lys, 2008). In this instance, figure 2 portrays the graphical representation of the formula and explains the meaning of each symbol (Cohen, Dey, & Lys, 2008). It determines the sources of data such as Compustat, which were used to gather the information and calculate the findings in the results section.
Real Earnings Management
- Manipulation Approaches:
- Hastening of the speed of sales by raising the price discounts or providing favourable credit terms (Cohen, Dey, & Lys, 2008).
- Reporting of the presence of the inferior price of goods sold through amplified manufacturing (Cohen, Dey, & Lys, 2008).
- Minimization of the expenses related advertising, R&D, and SG&A (Cohen, Dey, & Lys, 2008).
- Highlights of Figure 6:
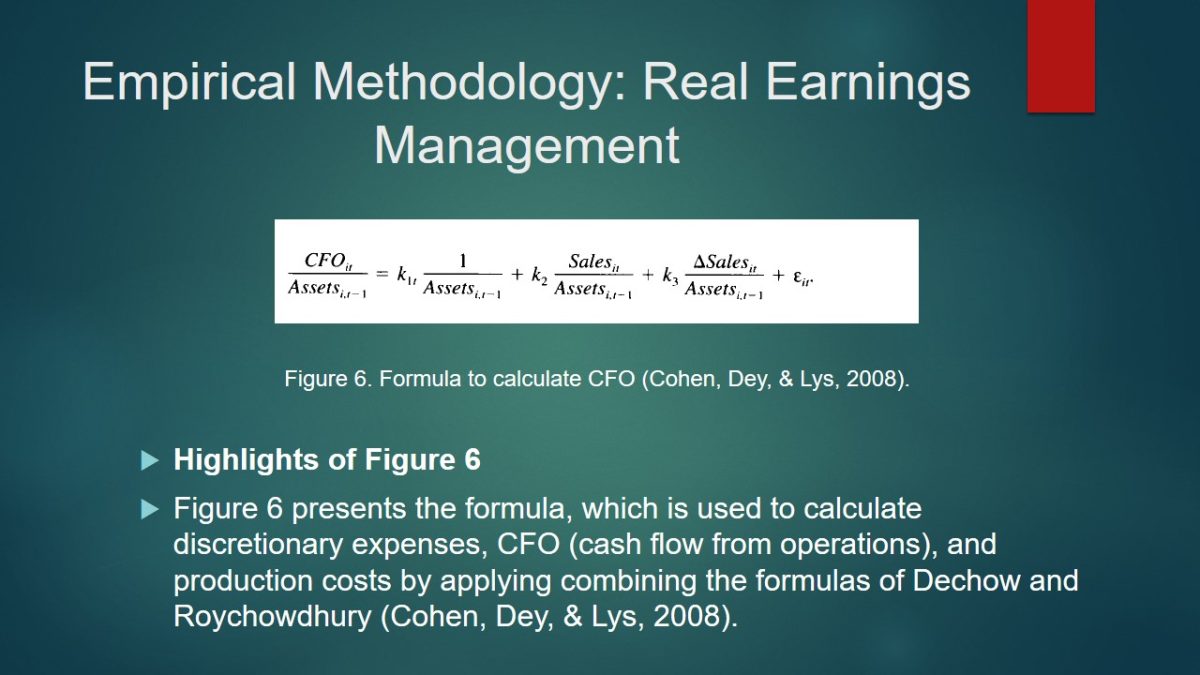
- Figure 6 presents the formula, which is used to calculate discretionary expenses, CFO (cash flow from operations), and production costs by applying combining the formulas of Dechow and Roychowdhury (Cohen, Dey, & Lys, 2008).
Slide 10 discusses the criteria for using the real earnings management based on pages 764 and 765. The researchers highly focus on the literature review, which reveals that the necessity to consider the irregular points of cash flow from the operations, and discretionary expenses and costs to determine the level of influences (Cohen, Dey, & Lys, 2008). The manipulation approaches are
- speeding the sales by raising the price discounts or providing favourable credit terms;
- reporting of the presence of the inferior price of goods sold through amplified manufacturing;
- minimization of the expenses related advertising, research, and development due to the potential increase in the period of earnings (Cohen, Dey, & Lys, 2008).
Based on the information, which is emphasized in the previous slides, Slide 11 presents the possibilities of calculation of the CFO depicted on page 765. In this instance, Figure 6 portrays the formula, which is used to calculate discretionary expenses, CFO (cash flow from operations), and production costs by applying combining the formulas of Dechow and Roychowdhury (Cohen, Dey, & Lys, 2008).
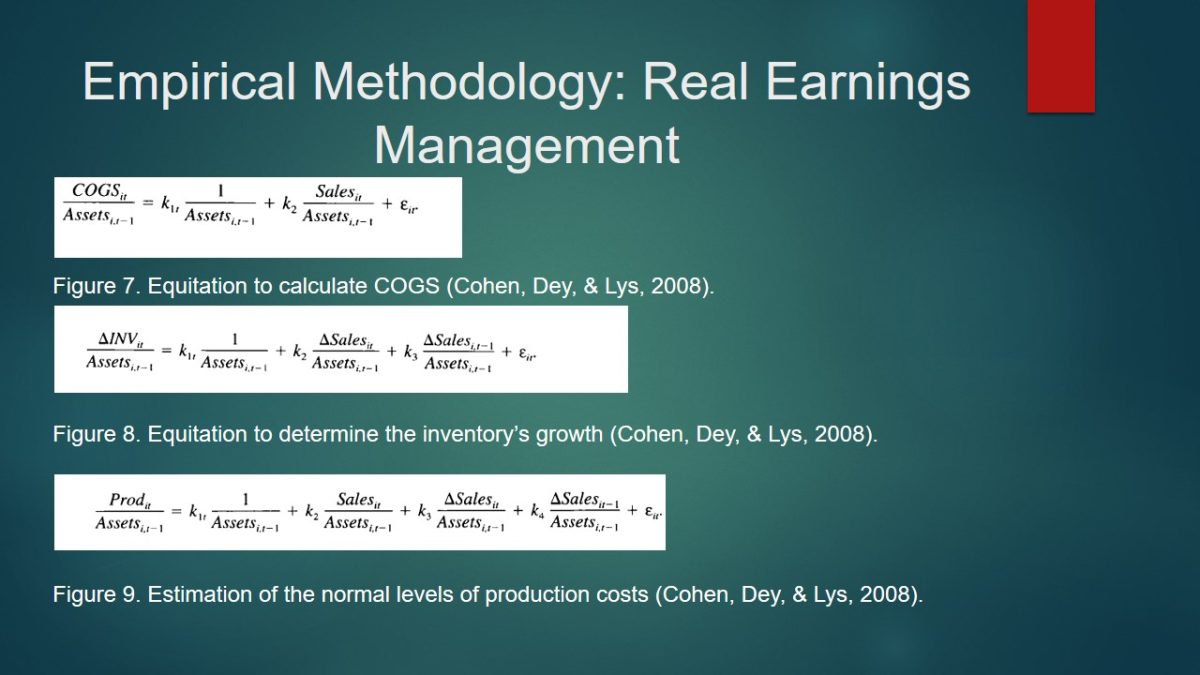
Slide 12 depicts the explanations of the formulas that are used to describe the calculations and applications of the real earnings management based on page 765. In turn, COGS (costs of goods sold) is also necessary to determine, and these findings are presented in Figure 7.
In turn, Figure 8 displays the equitation to determine the growth of inventory.
Furthermore, the normal levels of productions are estimated with the assistance of the formula, which is offered in Figure 9. It is constructed based one Figures 7 and 8.
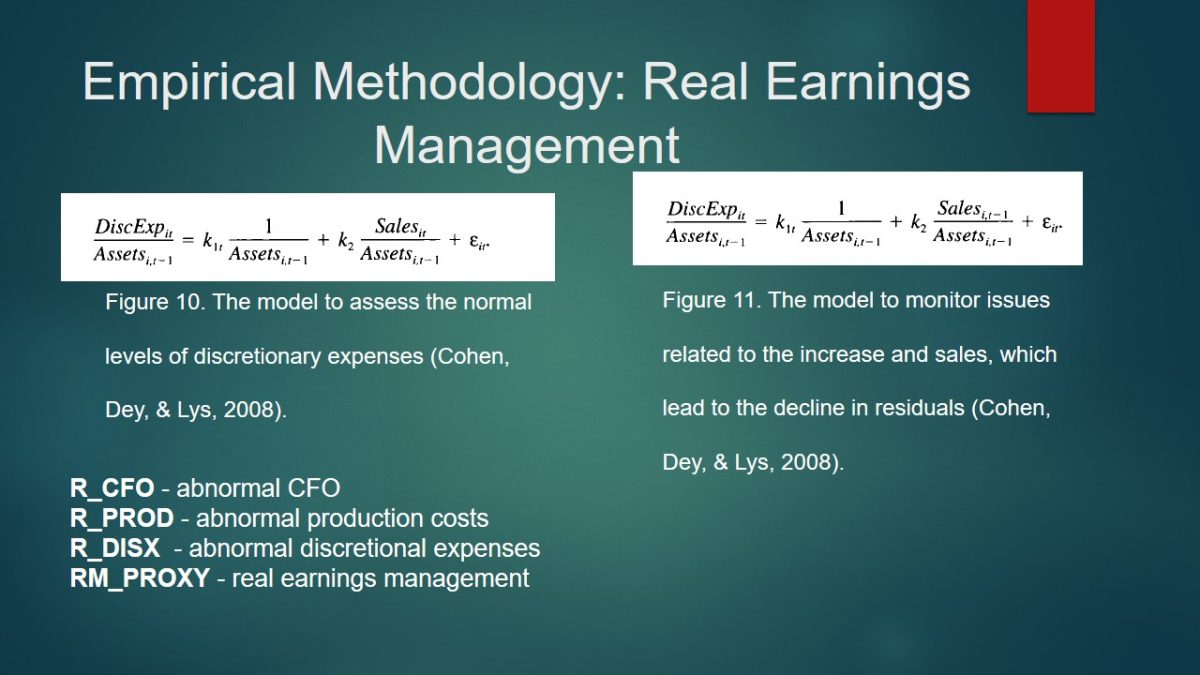
Furthermore, Slide 13 also depicts and explains the content of the formulas, which are presented on page 765. In turn, Figure 10 portrays the model of the determination of the normal levels of discretionary expenses.
Figure 11 addresses the issues of the necessity to increase the sales to enhance the level of reported earnings, which implies the decrease in residuals (Cohen, Dey, & Lys, 2008). It has to be mention that CFO is the cash flow from operations, t – time period, Prod – production costs, and DiscExp – discretionary expenses. In turn, the R_CFO (abnormal CFO), R_PROD (abnormal production costs), R_DISX (abnormal discretional expenses), and RM_PROXY (real earnings management) are used to measure the results.
Tests and Results
Descriptive Statistics
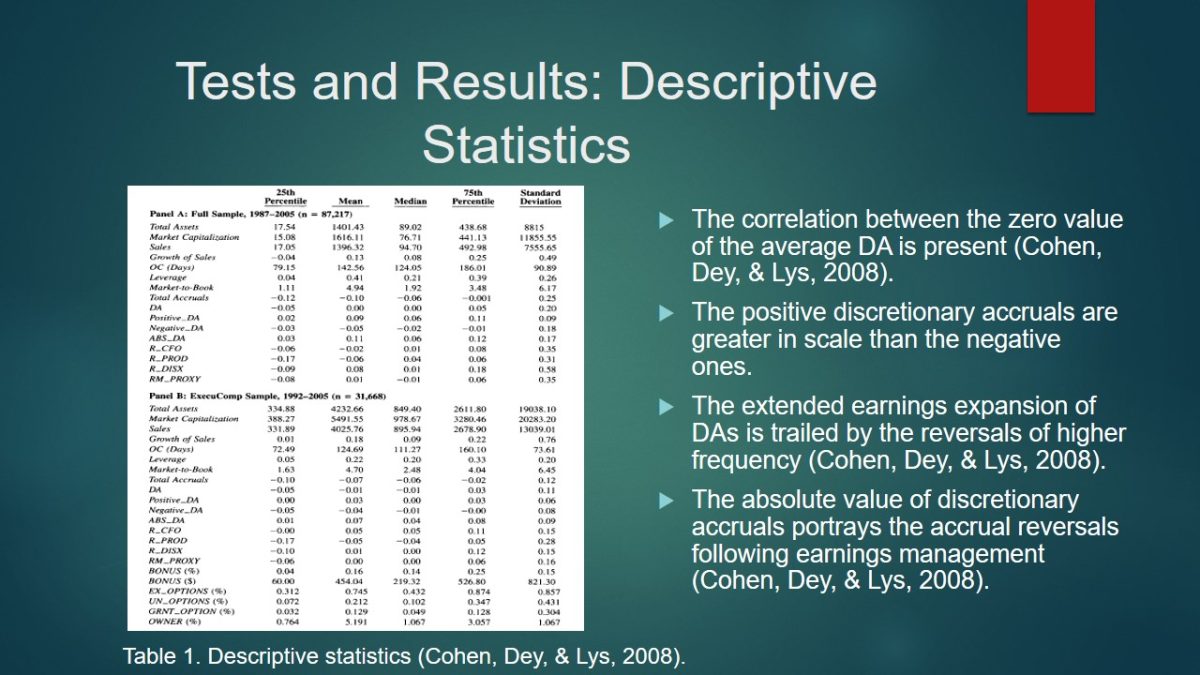
The goal of Slide 14 is to start the description of the findings by describing the results portrayed in the table on pages 767-769. It is apparent that Table 1 provides the summary of the statistical data based on the information acquired from the selected databases. The panel B focuses on the information of ExecuComp, and the samples are larger while assessing total assets and market capitalization (Cohen, Dey, & Lys, 2008). The value of total assets is negative in the past year with the standard deviation of 0.25 for the overall sample, and the discretionary accruals are 0.00 for the full sample, and -0.11 for the ExecuComp subsample (Cohen, Dey, & Lys, 2008).

- The correlation between the zero value of the average DA is present (Cohen, Dey, & Lys, 2008).
- The positive discretionary accruals are greater in scale than the negative ones.
- The extended earnings expansion of DAs is trailed by the reversals of higher frequency (Cohen, Dey, & Lys, 2008).
- The absolute value of discretionary accruals portrays the accrual reversals following earnings management (Cohen, Dey, & Lys, 2008).
Slide 15 describes Table 1, and it emphasizes the correlation between the zero value of the average DA and depicts the positive discretionary accruals are greater in scale than the negative ones, and the extended earnings expansion of DAs is trailed by the reversals of higher frequency. The absolute value of discretionary accruals portrays the accrual reversals following earnings management (Cohen, Dey, & Lys, 2008).
The additional analysis was conducted by selecting the companies with the absolute value of DA, and more than half of the companies have drastic asset impairment while others have a major increase in the accounts receivable.
Time-Trends Correlation Matrix
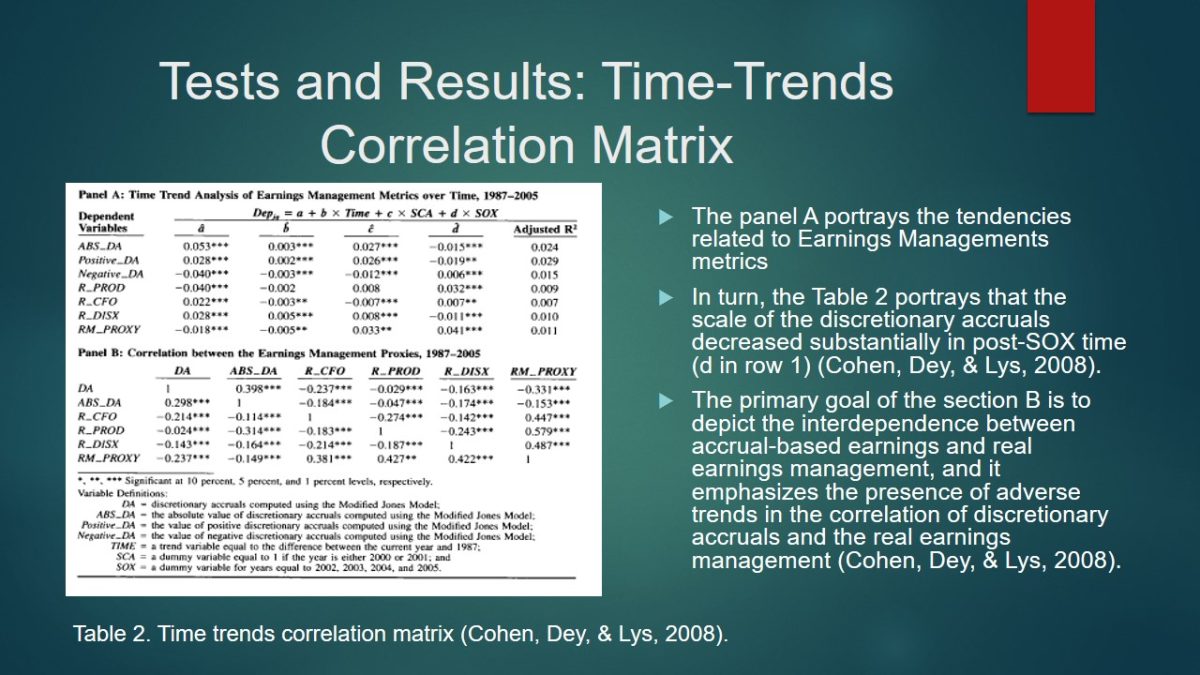
- The panel A portrays the tendencies related to Earnings Managements metrics.
- In turn, the Table 2 portrays that the scale of the discretionary accruals decreased substantially in post-SOX time (d in row 1) (Cohen, Dey, & Lys, 2008).
- The primary goal of the section B is to depict the interdependence between accrual-based earnings and real earnings management, and it emphasizes the presence of adverse trends in the correlation of discretionary accruals and the real earnings management (Cohen, Dey, & Lys, 2008).
Slide 16 provides the description of Table 2 (p. 771), as it displays the trends, which are limited to the selected timeframe, accrual and real earnings management. The panel A portrays the tendencies related to Earnings Managements metrics. In turn, the Table 2 portrays that the scale of the discretionary accruals decreased substantially in post-SOX time (d in row 1) (Cohen, Dey, & Lys, 2008). The primary goal of the section B is to depict the interdependence between accrual-based earnings and real earnings management, and it emphasizes the presence of adverse trends in the correlation of discretionary accruals and the real earnings management (Cohen, Dey, & Lys, 2008).
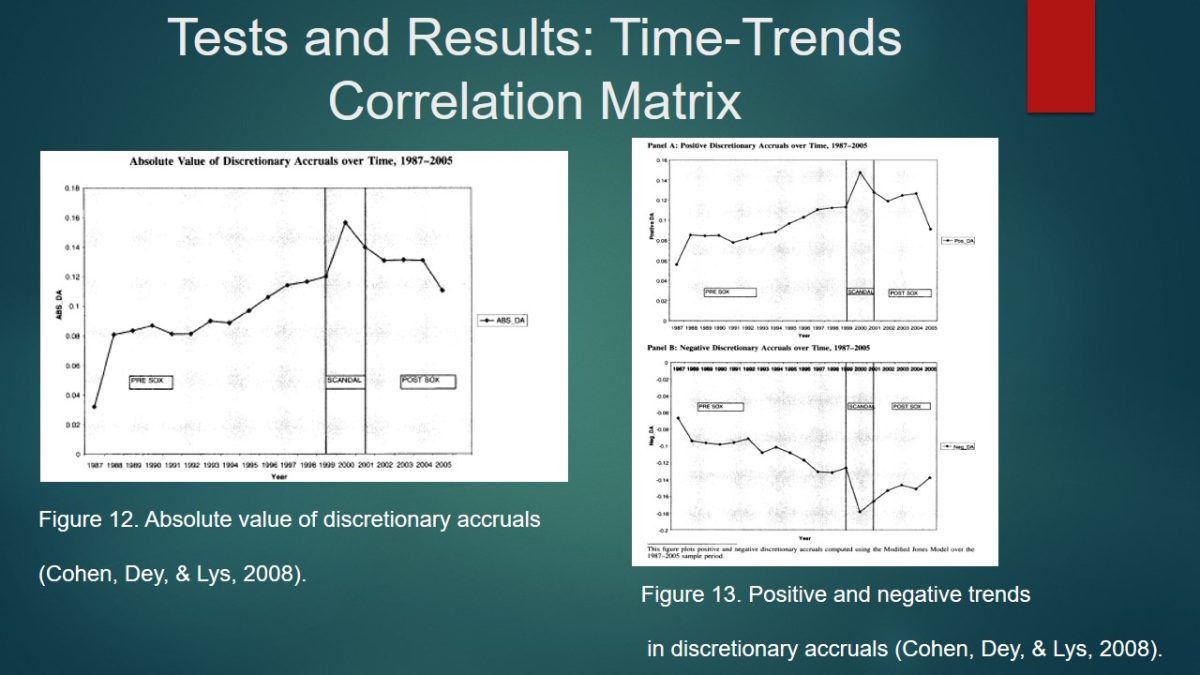
It is apparent that it is vital to display a graphical representation of the results, which are presented in Table 2, as the presence of the particular trends will be clear. In this case, Figures 12 focuses on the absolute value of discretionary accruals (p. 772), and Figure 13 portrays positive and negative trends (p. 773).
In this instance, Figure 12 depicts the presence of the popularity of the earnings management in during SCA. In turn, Figure 13 shows that the positive discretionary accruals reached its highest point during SCA, and the negatives ones were low respectively (Cohen, Dey, & Lys, 2008). In turn, the discussed tendencies have a upturned nature in the post-SOX period.
Real Earnings Management Proxies
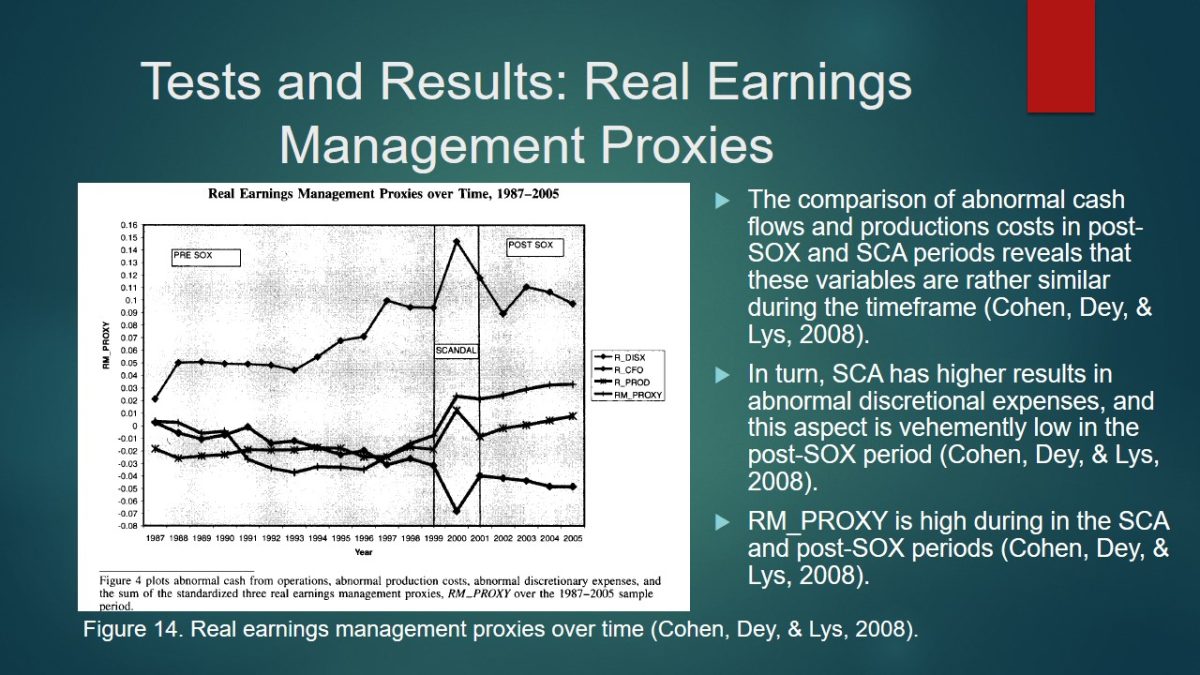
- The comparison of abnormal cash flows and productions costs in post-SOX and SCA periods reveals that these variables are rather similar during the timeframe (Cohen, Dey, & Lys, 2008).
- In turn, SCA has higher results in abnormal discretional expenses, and this aspect is vehemently low in the post-SOX period (Cohen, Dey, & Lys, 2008).
- RM_PROXY is high during in the SCA and post-SOX periods (Cohen, Dey, & Lys, 2008).
Slide 18 illustrates the trends presented on pages 770-771. These matters are portrayed with the assistance of Figure 14 and do not have a tendency to rise in the selected period. The comparison of abnormal cash flows and productions costs in post-SOX and SCA periods reveals that these variables are rather similar during the timeframe (Cohen, Dey, & Lys, 2008). In turn, SCA has higher results in abnormal discretional expenses, and this aspect is vehemently low in the post-SOX period.
RM_proxy is a combination of abnormal production costs, abnormal discretionary expenses, and abnormal cash flow, and it has a tendency to decrease over time (Cohen, Dey, & Lys, 2008). It is high during in the SCA and post-SOX periods.
Summary
- The core outcome is the ability to emphasize that the implementation of the accrual-based earnings management was in decline from post-SCA period to post-SOX period.
- In turn, the popularity of the real earnings management experienced the rise in the post-SOX period (Cohen, Dey, & Lys, 2008).
- Furthermore, the SCA-period can be portrayed as the time for the increased earnings management by the fact that the scandal companies have an understanding of the application of accrual management.
Reasons for the Decline in Utilization of Accrual-Based Earnings
- A decrease in advantageous discretionary accruals.
- The presence of SOX.
- The Governmental failures in regulations.
- The inability to detect the earnings in the firms.
Slide 19 reflects the information, which was presented on pages 770-771. The core outcome is the ability to emphasize that the implementation of the accrual-based earnings management was in decline from post-SCA period to post-SOX period. In turn, the popularity of the real earnings management experienced the rise in the post-SOX period (Cohen, Dey, & Lys, 2008). Furthermore, the SCA-period can be portrayed as the time for the increased earnings management by the fact that the scandal companies have an understanding of the application of accrual management.
Slide 20 presents the aspects, which were highlighted on page 771. Reasons for the decline in utilization of accrual-based earnings can be explained by the decrease in advantageous discretionary accruals, the presence of SOX, the governmental failures in regulations, and the inability to detect the earnings in the firms (Cohen, Dey, & Lys, 2008).

Trends In and Determinants in Earnings Management
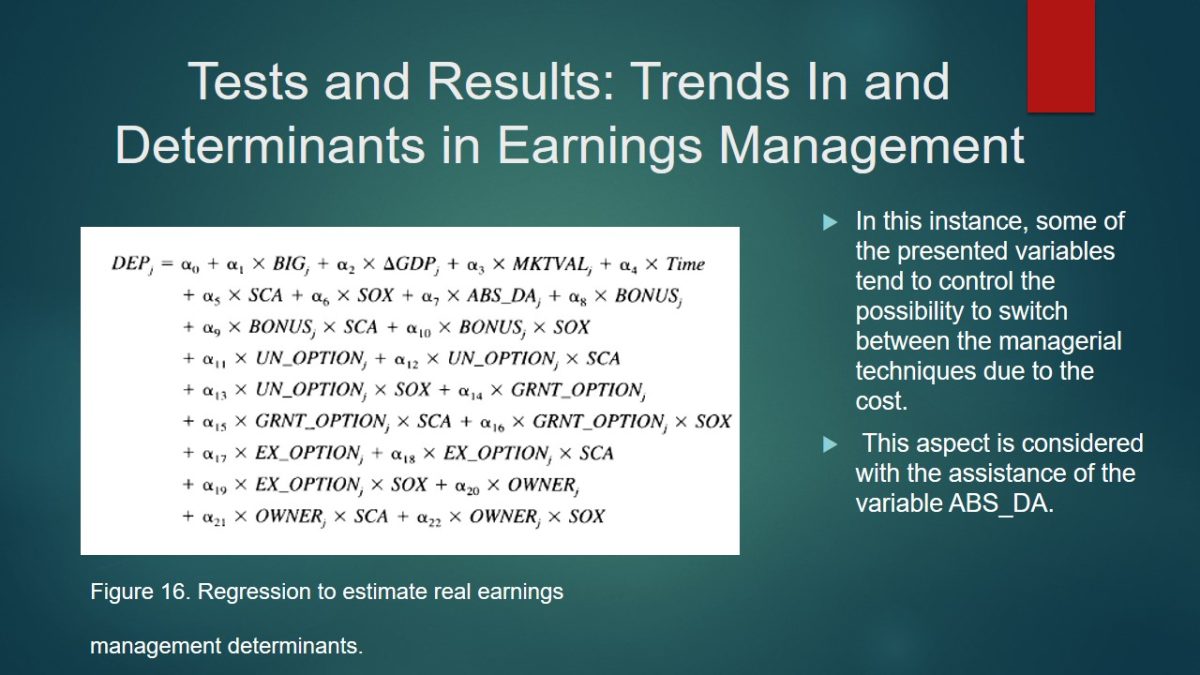
The substantial goal of the next section is to portray the determinants of earnings management with the assistance of the regression and its description, which are emphasized on pages 774-775. In this case, Figure 15 depicts the regression, which was used to measure these aspects with the description of the variables. In this instance, the introduction of the changes in GDP could be considered as the most important variable due to the potential presence of external influences.

- In this instance, some of the presented variables tend to control the possibility to switch between the managerial techniques due to the cost.
- This aspect is considered with the assistance of the variable ABS_DA.
Slide 22 focuses on the presentation of the regression on page 776. In this instance, some of the presented variables tend to control the possibility to switch between the managerial techniques due to the cost. This matter is considered with the assistance of the variable ABS_DA.
Results
Determinants of accrual based earnings management activities
The amount of compensation acquired from the identified possibilities has positive relations with the discretionary accruals (Cohen, Dey, & Lys, 2008).
It could be said that this slide is the start of a new section, which is related to the presentation of the results depicted on pages 777-779. In this instance, Figure 17 is used to display the findings. The amount of compensation acquired from the identified possibilities has positive relations with the discretionary accruals (Cohen, Dey, & Lys, 2008).

Compensation over Time
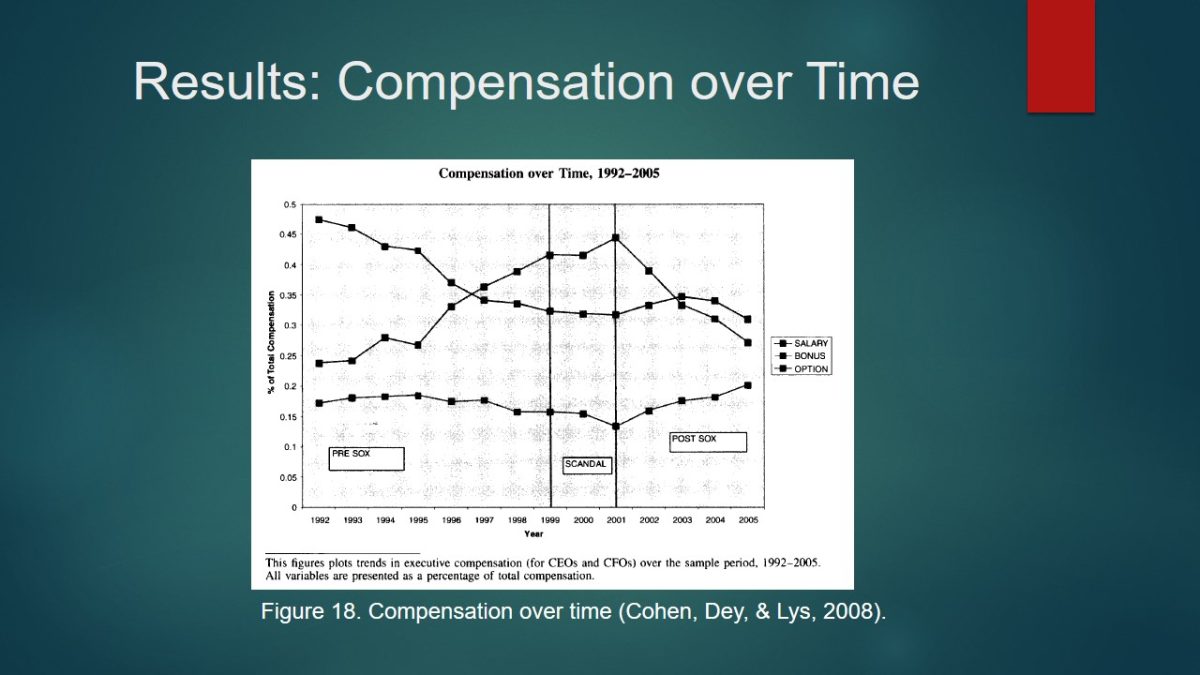
The primary goal of slide 24 is to depict the graphical representation of the results of Figure 17 with the assistance of Figure 18 (p. 780).
Determinants of real Earnings Management Activities
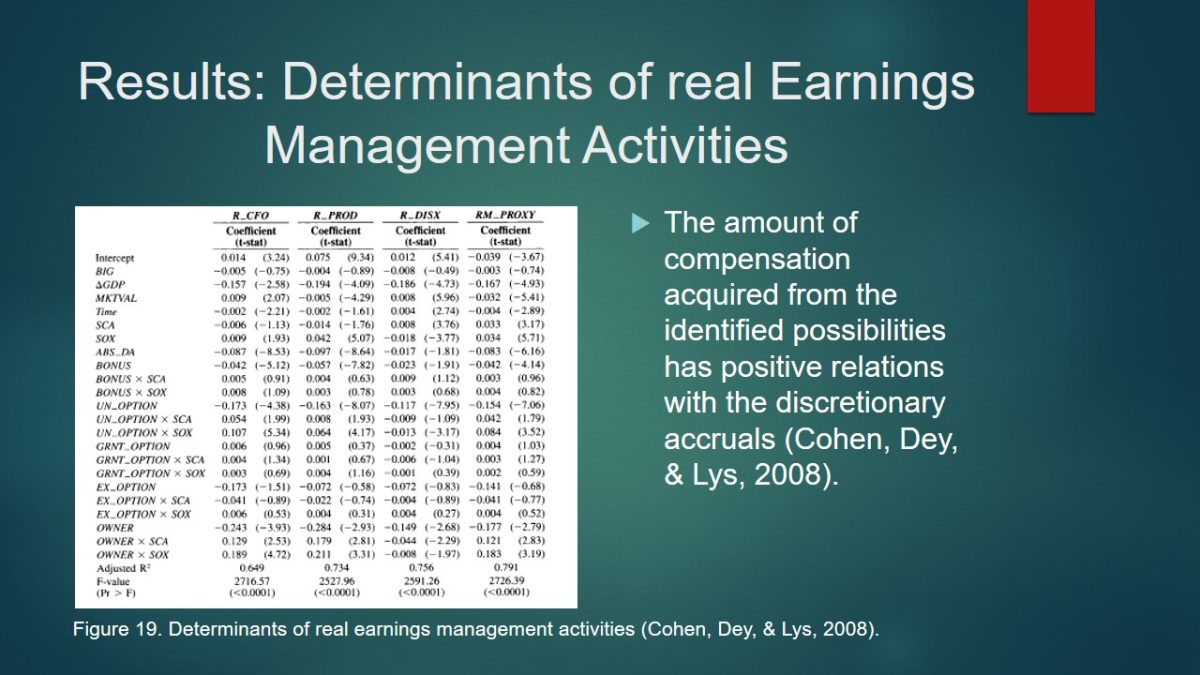
The amount of compensation acquired from the identified possibilities has positive relations with the discretionary accruals (Cohen, Dey, & Lys, 2008).
Slide 25 depicts the results of the real earnings management by utilizing the regression and portraying in the table by using Figure 19 (page 782). The amount of compensation acquired from the identified possibilities has positive relations with the discretionary accruals (Cohen, Dey, & Lys, 2008).
Summary of Multivariate Analysis
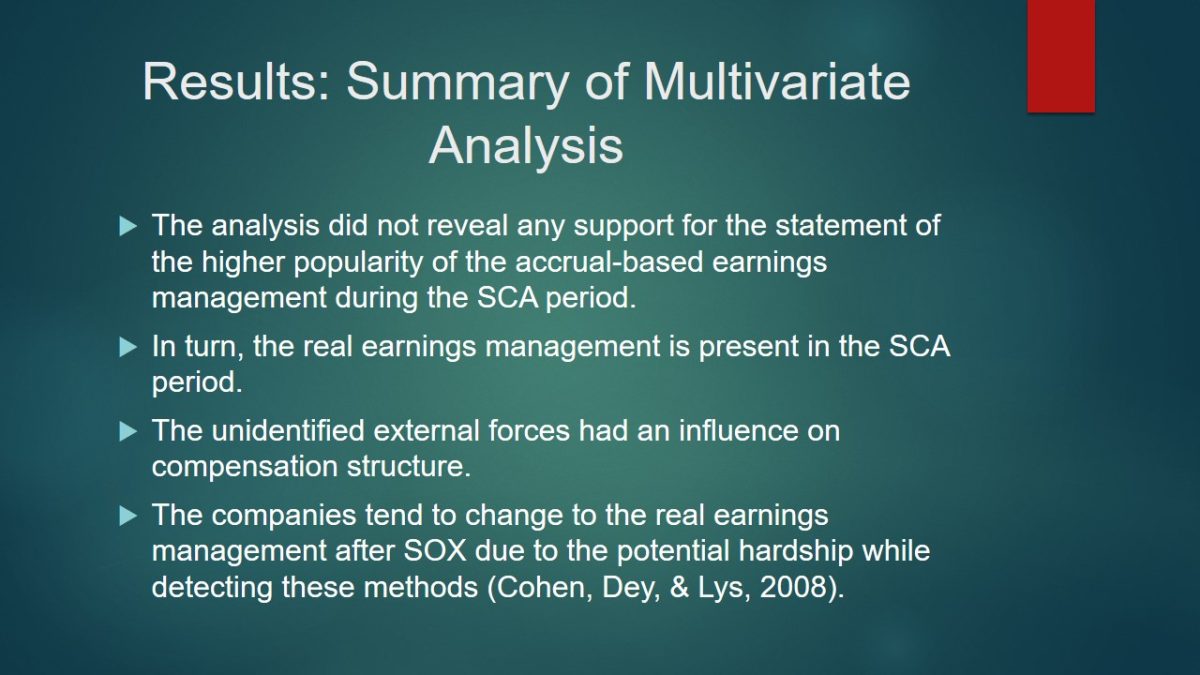
- The analysis did not reveal any support for the statement of the higher popularity of the accrual-based earnings management during the SCA period.
- In turn, the real earnings management is present in the SCA period.
- The unidentified external forces had an influence on compensation structure.
- The companies tend to change to the real earnings management after SOX due to the potential hardship while detecting these methods (Cohen, Dey, & Lys, 2008).
Slide 26 highlights the findings presented on page 783. The analysis did not reveal any support for the statement of the higher popularity of the accrual-based earnings management during the SCA period (Cohen, Dey, & Lys, 2008). In turn, the real earnings management is present in the SCA period. The unidentified external forces had an influence on compensation structure. The companies tend to change to the real earnings management after SOX due to the potential hardship while detecting these methods (Cohen, Dey, & Lys, 2008).
SUSPECT FIRMS’ Analysis
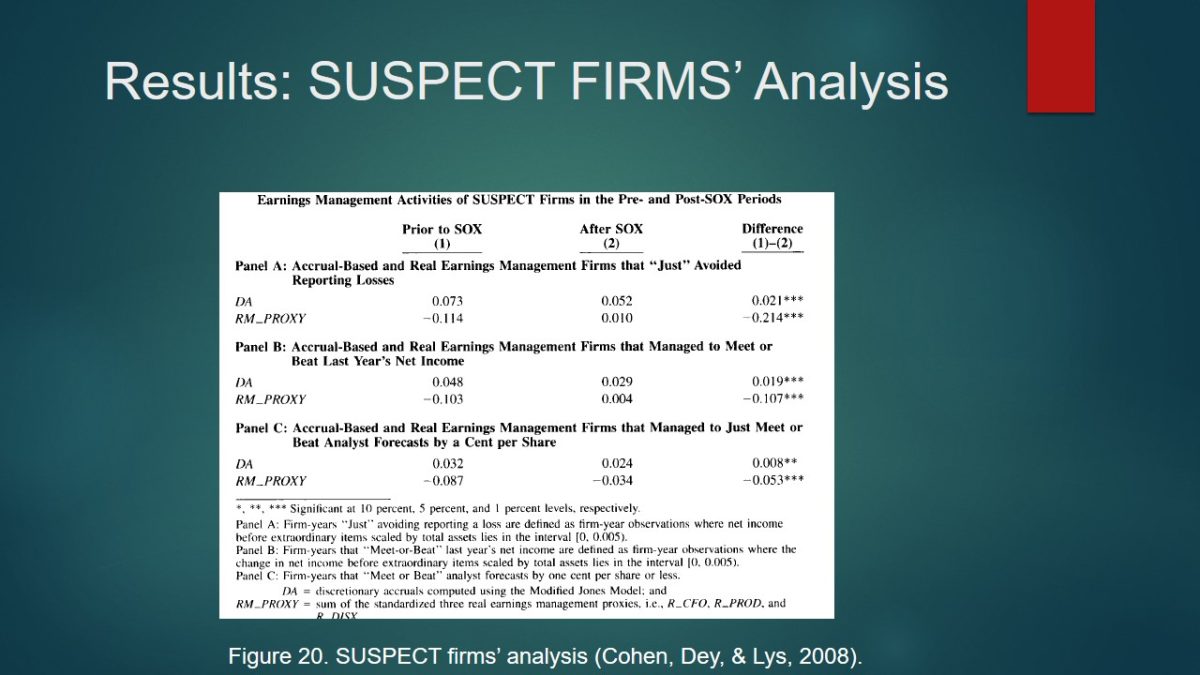
This section presents the analysis of SUSPECTS firms, which were used for the analysis depicted on pages 783-784. In this instance, Figure 20 is used to portray the results.
Conclusion
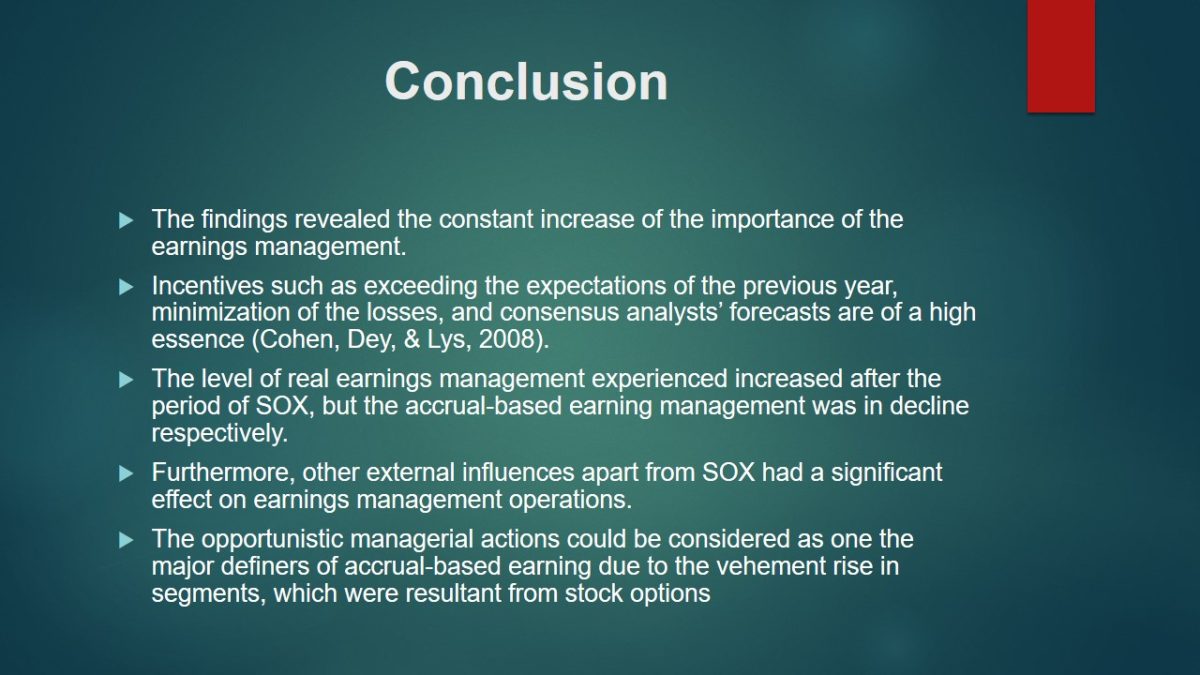
- The findings revealed the constant increase of the importance of the earnings management.
- Incentives such as exceeding the expectations of the previous year, minimization of the losses, and consensus analysts’ forecasts are of a high essence (Cohen, Dey, & Lys, 2008).
- The level of real earnings management experienced increased after the period of SOX, but the accrual-based earning management was in decline respectively.
- Furthermore, other external influences apart from SOX had a significant effect on earnings management operations.
- The opportunistic managerial actions could be considered as one the major definers of accrual-based earning due to the vehement rise in segments, which were resultant from stock options.
Slide 28 summarizes the summary of the conclusive section of the article. The findings revealed the constant increase of the importance of the earnings management. Incentives such as exceeding the expectations of the previous year, minimization of the losses, and consensus analysts’ forecasts are of a high essence (Cohen, Dey, & Lys, 2008). The level of real earnings management experienced increased after the period of SOX, but the accrual-based earning management was in decline respectively. Furthermore, other external influences apart from SOX had a significant effect on earnings management operations. The opportunistic managerial actions could be considered as one the major definers of accrual-based earning due to the vehement rise in segments, which were resultant from stock options.
Reference
Cohen, D., Dey, A., & Lys, T. (2008). Real and accrual-based earnings management in pre- and post-Sarbanes-Oxley periods. The Accounting Review, 83(3), 757-787.