Introduction
Regional Call Center’s Washington, DC, facility provides contract call center services to different companies, including banks and major retail companies. At the moment, I serve as the supervisor at the facility. Immediately after graduating with a master’s degree in business administration from Strayer University, I got employed at the facility and I have been attached to it for over seven years. I take part in the company’s staff meetings held every month after which the CEO handed over additional responsibilities to me. The new assignment rose out of one of the client’s request to be handed a report describing the calls being handled for them by the company.
The CEO specified that I analyze the data in a file called Regional Call Center and make a report that would present my findings using graphics and in numerical form. I was able to collate a sample of 57 calls for the analysis. The collected data has four main variables, which are the client’s account number, past due amount, current account balance, and nature of call (billing question or other). The following sections present the different analyses conducted and a description of the findings. The analysis primarily involved the use of descriptive statistics.
Mean and Median Current Account Balance

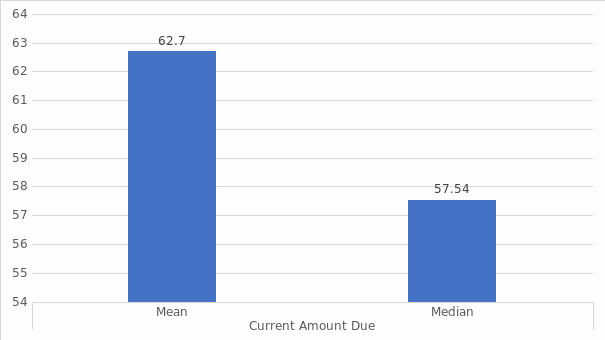
The mean is the average value of the data set while the median is the middle value of the data. The mean is arrived at by summing the values then dividing by the count of the data sets. The median is obtained by arranging the data in an ascending order from the smallest to the largest, the picking the middle value (Linneman, 2018). Table 1 above indicates that the mean and the median for the current amount due data are 62.7 And 57.5, respectively.
Scatter Diagram: Current Balance versus Past Due Amount

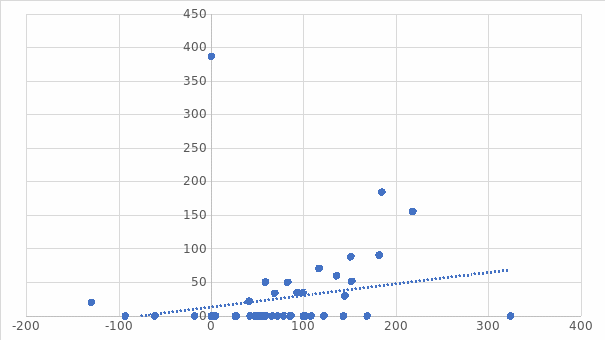
The scatter diagram is an XY plot that graphically depicts the relationship between two sets of data. It gives an impression of how the data is related. In general, if data points are scattered, there is a low correlation between the data points while in a perfect correlation, the data points are largely in one line (Mcbride, 2019). Figure 1 above shows a positive relationship between the current balance on the horizontal axis and past due amount on the vertical axis, as evidenced by an upward sloping trendline. However, the blue dots indicate that the data pints are somewhat scattered an indication that the relationship between the current balance and the past due amount is not perfect.
Descriptive Statistics for Current Balance and Past Due Amount
Table 2: Descriptive Statistics for Current Balance and Past Due Amount
Descriptive statistics are statistical measures the summarize a given dataset. The measures are broadly grouped into three categories, namely; measures of variability (spread or dispersion), measures or central tendency (averages), and measures of distribution (frequency) (Witte & Witte, 2017). The main measures of variability include the standard deviation, variance, and range. From table above, the standard deviation and variance for the past due amount and current balance is 61.7, 75.6, and 3803.1, 512.3, respectively. The range, which shows the divergence in the extreme values (minimum and maximum) is 386.77 and 453.45, in that order. The minimum and maximum values for the past due amount and current balance are 0, -129.67, and 386.77, 323.78, respectively.
The measures of central tendency include the mean, mode, and median. The mean for the past due amount and current balance is 23.9 and 62.7, correspondingly, the median is 0 and 57.5, in that order. The mode, which represents the most frequent value, is 0, meaning that in most times the clients had a zero balance as by the past due amount and current balance for the period of the data. The sums for both balances are 1364.95 and 3573.8, respectively. The measures of distribution are skewness, which the distribution by symmetry, and kurtosis, which measures frequency by the tails (Witte & Witte, 2017). The skewness for the past due amount and current balance is 4.3 and 0.6, respectively. The corresponding kurtosis is 22.1 and 2, indicating that balances under the past due amount are heavily tailed.
Descriptive Statistics for the Past Due Balances
Table 3: Descriptive Statistics for the Past Due Balances
Table 3 above shows the descriptive statistics for the past due balances. The mean past due balance, the mode and median were 23.95, 0, and 0, respectively. The past due balance had a standard deviation and variance of 61.7 and 3803.1, correspondingly. The kurtosis and skewness were 22.1 and 4.3, in that order. The minimum past due balance was 0, while the maximum was 386.77 resulting to a range of 386.77. In total, the past due balance for the 57 data points was 1364.95.
Coefficient of Variation for Current Account Balance
Coefficient of variation is a statistical measure of spread relative to the mean; it shows the extent to which data varies from the average value. It is arrived at by dividing the standard deviation of data by its mean value (Johnson & Wichern, 2019). Even as different data sets may have the same standard deviation, the coefficient of value will vary given the differences in the mean value. The coefficient of variation for the current account balance is given by:
- Coefficient of variation (current account balance) = standard deviation / mean
- Coefficient of variation (current account balance) = 75.5806676 / 62.6982456
- Coefficient of variation (current account balance) = 1.21, which indicates that the standard deviation is 1.21 times higher than the mean and points to a higher spread in the data.
Conclusion
The analysis for the client balances was analyzed covering 57 data points. The scatter plot between the current balance on the horizontal axis and past due amount on the vertical axis points to a weak and positive relationship between the two datasets. In general, descriptive statistics show that the past due amount had a lower measure, including the mean, median, standard deviation, variance, range, and sum compared to the current due balance. The coefficient of variation for current account balance is 1.21, which indicates that the standard deviation is 1.21 times higher than the mean and points to a higher spread in the data.
References
Johnson, R. A., & Wichern, D. W. (2019). Applied multivariate statistical analysis. Pearson.
Linneman, T.J. (2018). Social statistics managing data, conducting analyses, presenting results. New York London Routledge.
Mcbride, D. M. (2019). The process of research and statistical analysis in psychology. Sage Publications, Inc.
Witte, R. S., & Witte, J. S. (2017). Statistics. Wiley. Web.