Introduction
The paper studied how renewable energy helps households save huge electricity bills in their homes. The study revealed that people are turning to renewable energy because it is friendly to pockets. Though characterized by the high cost of installation, green energy is worth it. The study compared solar energy to biogas to determine which can be a viable investment. Biogas uses readily available substrate materials that consume considerable time to prepare them. This is an involving task to many people considering their daily schedules. During preparation, health is compromised because of exposure to disease-causing viruses and bacteria (Hengeveld et al., 2016). Again, the research finds that the cost of installation is higher compared to solar energy sources.
Solar projects are preferred because their cost of installation is relatively lower compared to biogas. The cost of maintenance is also kept low and not much attention is required to ensure continued power supply. Unlike biogas, that one changes substrates, solar does not need any input after installation (Chakravarthi, 2002). Expanding solar system does not need many resources, just fixing more solar panels to the existing array, a charge controller and backup batteries. Therefore, the researcher preferred solar power because of the conveniences associated.
The quantitative data collection method was used to obtain data and represent them in the tables. Several projects were compared then the preferred one was used to set a project as an investment (Ho et al., 2019). The projects were chosen from reputable firms in the renewable energy sector. Data analysis was done using line graphs to determine project viability as investments. Renergon, an Indian firm, was used to get all required information on biogas plants, while Solar World (K) provided the required information and supply of all requirements for the solar project. Finally, the conclusion gives summaries and recommendations on improvement on the projects.
Motivation
Renewable energy has been there for many years before even most of us were born. The use of non-renewable energy sources could not sustain the ever-growing population. Studies revealed an ecosystem imbalance after realizing that wood, the major source of energy was falling short (Scarano, 2017). Researchers, therefore, found that alternative energy sources were the only option. Several renewable energy sources were discovered to supplement natural sources of energy. These are solar, Biomass, hydropower, wind, geothermal, and tidal energy sources. These energy sources can be reused accordingly to continue supplying power required the consumers. However, the paper is going to compare solar and biogas energy sources.
Data Collection
Quantitative data collection was used where a company provided a set of project examples, for the researcher to choose from depending on project viability. The table below shows commercial solar and biogas projects.
Table 1. Biogas Production Statistics.
Table 1 above represents data collected through a biogas calculator app owned Renergon Energy Sustainable Systems, a company dealing with biogas plant installation in India (Renergon, 2012). In its implementation, two substrates are combined in a digester to produce gas. Cattle and chicken manure (tonnes) are combined in a digester to produce the gas. The table also shows the annual gas production, households supported, organic manure made and revenue received from each project.
Digester three was preferred and calculation and analysis are done in reference to it. The cost of installing was $3000 and the proactive lifetime estimated at 10 years, and cost maintenance stands at $8,000 per year. The project is implemented using a loan from the KCB Bank under the conditions stated below. The bank approved a loan of $40,670 with 15% and 13%, flat and compound interests respectively, and to be repaid in 4 years.
Table 2. Solar Production.
Table 3. Solar Cost Table.
Table 2 shows an array of solar panel combinations, power output, and revenue generated monthly. These are small commercial projects showing installation costs and power production. Project six has been used to calculate and analyze the data to determine business viability. Table 3 shows the cost of project items and projected maintenance cost stands at Ksh30, 000. The data was acquired from a quotation received from Solar World Company (K). Due to resource constraints, the project received funding from the Equity Bank. KSH 280, 000 loans were given recoverable in 5 years attracting 13% and 11%, flat and compound interests respectively.
Data Analysis and Results

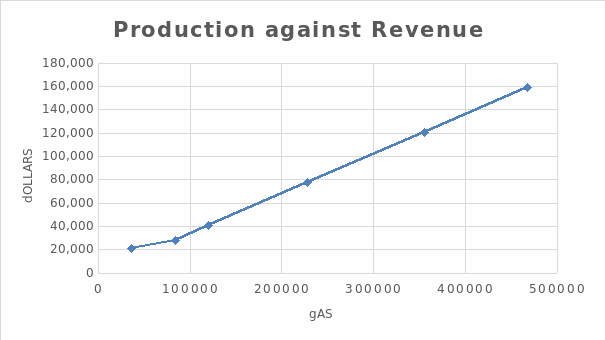
The graph indicates how mass production can generate more revenue for the project. The company was adding more digesters to the system at specified intervals of time. Added digesters increased production and revenue too.

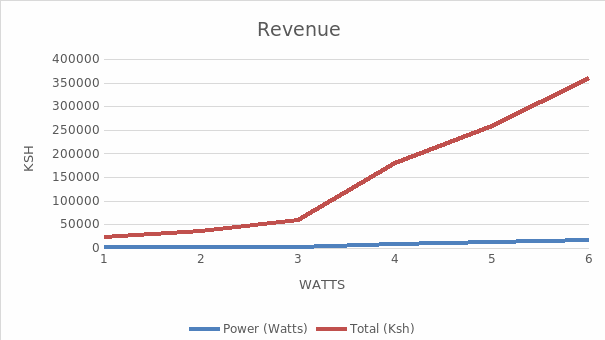
The graph shows how the different projects run by the company generated revenue depending on the number of solar panels installed, this explains why more power was generated in project 6.
Summery and Conclusion
Alternative energy has brought relief to household expenditure on power consumption in homes and offices alike. In the study, the two projects have shown a tremendous reduction of bills (Dranka et al., 2020). The Biogas plant produces energy for both cooking and lighting homes while Solar powers almost all home electric equipment depending on its power rating capacity. The study concludes that biogas project has high investment and maintenance costs and therefore cannot be the best option for small and medium commercial projects (Phebe & Samuel, 2016). Solar power can be preferred on the account that it is relatively cheaper to install and maintain compared to biogas.
More solar panels in arrays mean more power production, this makes scaling up the system much easier because one only needs to add panels to the existing arrays. It is also environmentally friendly since no Co2 is produced to pollute the air unlike in bios where traces of Co2 are realized. Finally, the use of green energy must be encouraged, heavy investment in such projects will not only offer employment but also boost the national power grid. This will reduce the unit cost of electricity consumed by individuals and industries to boost the Gross Domestic Product.
References
Chakravarthi J., (2002). Biogas and energy production from cattle waste. Web.
Dranka, G. G., Ferreira, P., & Vaz, A. I. F. (2020). Cost-effectiveness of energy efficiency investments for high renewable electricity systems. Energy, 198, 117198.
Hengeveld, E. J., Bekkering, J., Van Gemert, W. J. T., & Broekhuis, A. A. (2016). Biogas infrastructures from farm to regional scale, prospects of biogas transport grids. Biomass and bioenergy, 86, 43-52.
Ho, J., Tumkaya, T., Aryal, S., Choi, H., & Claridge-Chang, A. (2019). Moving beyond P values: Data analysis with estimation graphics. Nature methods, 16(7), 565-566.
Phebe Asantewaa Owusu & Samuel Asumadu- Sarkodie (2016). A review of renewable energy sources, sustainability issues and climate change mitigation. Web.
Renergon (2021). Biogas calculations App. Web.
Scarano, F. R. (2017). Ecosystem-based adaptation to climate change: concept, scalability and a role for conservation science. Perspectives in Ecology and Conservation, 15(2), 65-73.