Current ratio
The table presented below shows the calculation of current ratios for a period of seven years.
(Source of data – City of Bishop 1)
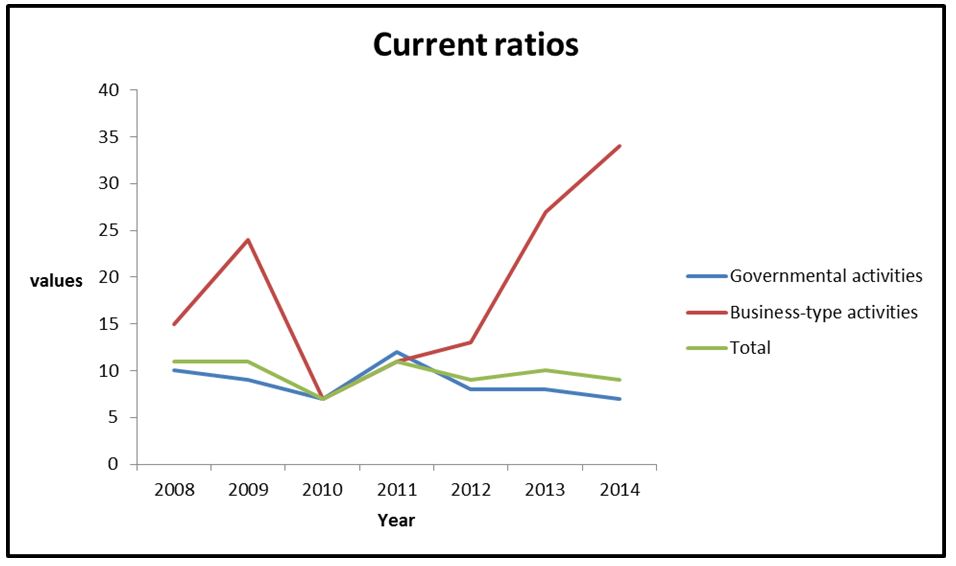
The graph presented below shows the trend of the current ratio for a period of seven years.

Discussion of the current ratio
The information in the table and graph above shows that the current ratio for the organization fluctuated during the period. The business-type activities segment had the highest value of current ratios during the period. The values of ratios for this segment were more volatile than that of governmental activities (McCarthy, Shelmon, and Mattie 141). This can be attributed to the volatile business environment. The graph also shows that governmental activities have a higher impact on the overall current ratio for the company as compared to business-type activities (Weikart, Chen and Sermier 98). This can be attributed to the high volume of governmental activities. Further, the results show that the entity has high values of current ratios. This can be attributed to the nature of business. The values indicate that the company is in a position to settle short-term obligations using current assets with ease. The analysis shows that the City of Bishop has a sound liquidity position. It also indicates that the company is efficient in managing working capital (Brigham and Michael 254).
Service charge ratio
The table presented below shows the calculation of service charge ratios for various functions at the City of Bishop.
(Source of data – City of Bishop 1)
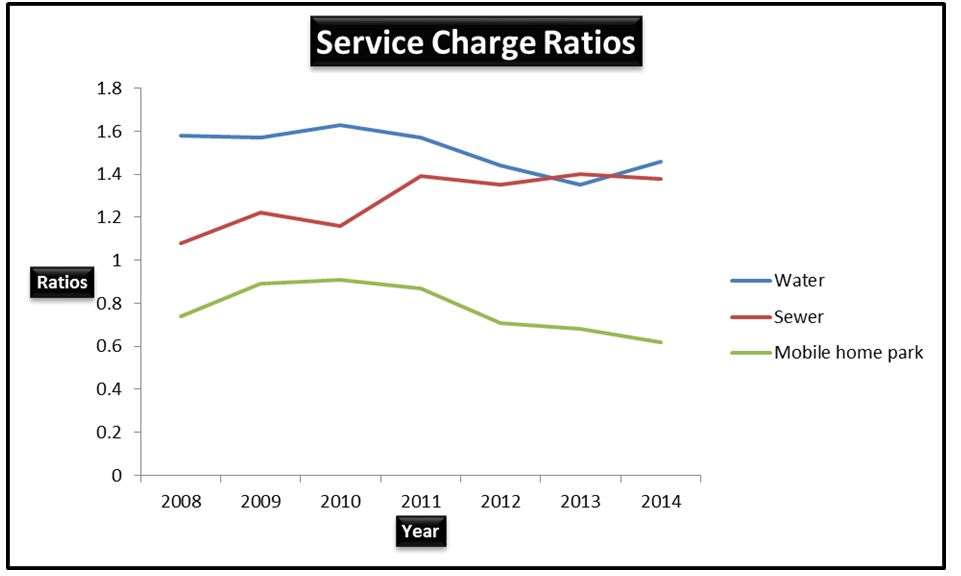
The graph presented below shows the trend of the service charge ratios for the three functions.

Discussion of service charge ratios
The values estimated in the table above and the graph above show that there was a general decline in the service charge ratio for both water and Mobile Home Park. In the case of Sewer, there was a general increase in the values of the service charge ratio. The trend of the values reported above can be attributed to the changes in the values of both the expenses and the charge for the services (Finkler, Purtell, Calabrese, and Smith 352). Finally, it can be observed that Water had the highest values of the service charge ratio, while Mobile Home Park had the least value. This trend is consistent across the industry (McMillan 198; City of Bishop 1).
References
Brigham, Eugene and Ehrhardt Michael. Financial Management Theory and Practice, USA: South-Western Cengage Learning, 2009. Print.
City of Bishop. Financial Statements. 2015. Web.
Finkler, Steven, Robert Purtell, Thad Calabrese and Daniel Smith. Financial Management for Public Health, and Not-for-Profit Organizations, USA: Pearson Education, In., 2013. Print.
McCarthy, John, Nancy Shelmon and John Mattie. Financial and Accounting Guide for Not-for-Profit Organizations, USA: John Wiley & Sons, Inc., 2012. Print.
McMillan, Edward. Not-for-Profit Budgeting for Nonprofit Organizations, USA: John Wiley & Sons, Inc., 2010. Print.
Weikart, Lynne, Greg Chen and Ed Sermier. Budgeting and Financial Management for Nonprofit Organizations: Using Money to Drive Mission Success, USA: Sage Publications, 2012. Print.