Various inventory management strategies are available depending on the overall business objective. According to Conley et al. (2019), “[w]ell-designed inventory management strategies are a crucial part of overall supply chain effectiveness” (p. 246). An effective approach requires a system keeping track of the inventory, a reasonable forecast of demand, and reliable estimates of holding, ordering, and shortage costs. This report aims to discuss the strategies implemented for the inventory management exercise involving two products, namely Adjustable Wrench and Rock Salt.
Adjustable Wrench
For the first scenario of the operations management simulation, a total of 16 simulations were completed for Adjustable Wrench. Each run involved 12 weeks, and the overall goal was to reduce the total cumulative cost (TCC) at the end of each circle. To achieve optimal outcomes, I implemented a strategy aiming to find order and reorder points that will minimize the total order and holding costs, keeping the customer demand and stockout penalty amount in mind.
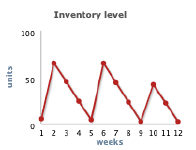
My goal was to keep the order costs, holding costs, and lost opportunity costs at a minimum level since they are generally associated with a significant impact on total inventory costs. Given the fixed order cost for the product of $6.30, regardless of the number of items ordered, I realized that the implementation of the Economic Order Quantity (EOQ) model could be an effective way to reduce the ordering cost. Instead of spending $6.30 weekly, ordering in bulk appeared to be more cost-efficient. With the relatively low holding cost per item ($0.04), the EOQ strategy suggested that 80 Adjustable Wrenches was the optimal order quantity to be purchased over a 4-week period, while the reorder point was found to be 20 Wrenches. As shown in Table 1, the utilization of this strategy allowed for receiving the total cumulative cost of $32.62 during Run 7. Furthermore, Figure 1 demonstrates the inventory level obtained for the simulation with the optimal TCC.
Table 1: Adjustable Wrench Simulations

Rock Salt
Similar to the Adjustable Wrench simulation, the Rock Salt simulations were derived upon the ordering and holding costs, as well as consumer demand anticipation. A total of 20 simulations were run to achieve the optimal solution. At the same time, it was evident that the primary difference between the two scenarios was due to standard deviation. The Rock Salt simulation was marked by a higher standard deviation of 9, while the Adjustable Wrench simulation was characterized by a standard deviation of 1. In other words, the consumer demand could be below or above the average mean. Such a characteristic indicated that incorrect forecasting of demand for Rock Salt was possible. In turn, inaccurate forecasts can result in a decrease in working capital and inventory, missed revenues, and excess materials (Gupta, 2020). Given the order cost of $6.30 and an increase in the holding cost to $0.07, I decided to apply a similar strategy based on the EOQ model for Rock Salt.
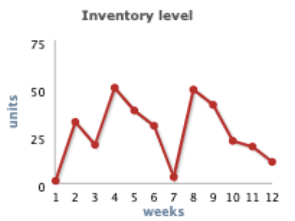
This approach proved to be effective by establishing the optimal total cost of 60 units of Rock Salt ordered every three weeks. Following the principle of economies of scale, it was evident that buying in bulk was more cost-efficient than weekly purchases. At the same time, while I aimed to reduce ordering costs, I increased the holding costs due to the standard deviation of 9 for the given product. As shown in Table 2, Run 3 with an order size of 60 units and reorder point of 30 units resulted in the total cumulative costs of $51.80. Similarly, run 16 resulted in a TCC of $53.62, which supports the suggestion of 60 units for order size and 30 units for reorder point. Figure 2 presents the inventory level chart for the run with the lowest TCC level.
Table 2: Rock Salt Simulations

Inventory Management Discussion
Upon the completion of the Inventory Management simulation, I confirmed that my ideas of the primary concepts were correct. The inventory costs that can significantly impact the business regardless of its scope and area include the order, holding, and lost opportunity costs (Konior and Szóstak, 2020). Hence, during the simulations, I aimed to keep these indicators low while keeping in mind the importance of customer demand to the outcomes. Maintaining the optimal stock is essential for effective inventory management, while the utilization of EOQ and economies of scale allow for appropriate budget allocation (Mittal and Shah, 2016). The application of these frameworks assisted me in reaching a low TCC level.
I can conclude that based on my simulation results presented in Tables 1 and 2, the EOQ determines the size of the order by establishing the optimal amount required at the lowest price possible. At the same time, the risk of stock loss and excessive order affect the order size as well (Patterson, 2021). The simulations for Adjustable Wrench and Rock Salt have indicated that ordering in bulk is cost-efficient when the order cost is fixed. However, standard deviation must be considered, as in the case with Rock Salt since it increases the holding costs.
Reference List
Conley, K. et al. (2019) ‘Effect of accounting policies on effectiveness of inventory management strategies’, Engineering Management Journal, 31(4), pp. 246-256. doi:10.1080/10429247.2019.1652056
Gupta, S. (2020) Working capital management through inventory management techniques. Raleigh: Lulu Publication.
Konior, J. and Szóstak, M. (2020) ‘Methodology of planning the course of the cumulative cost curve in construction projects’, Sustainability, 12(6), pp. 1-22. doi:10.3390/su12062347
Mittal, M. and Shah, N. H. (eds.) (2016) Optimal inventory control and management techniques. Hershey: IGI Global.
Patterson, A. M. (2021) Three strategies for inventory management in a small business. Web.