Abstract
The spring constant (k) and the natural frequency were calculated from the free-vibration experiment (f) results. The experiments consisted of two distinct phases. The initial step is a load-deflection test to establish the spring constant (k). The graph decoder must read the plotted graph, which we had to do by hand (Schellhammer et al., 2018).
We calculated the spring’s natural frequency (f) using the graph decoder’s output. The graph is generated by stretching the spring and then releasing it to cause vibration, which is read by a graph decoder. The next step is to contrast the computed value using the natural frequency equation with the value obtained from experiments.
Introduction
When no externally imposed forces are present, and an initially disturbing system can oscillate on its own, the result is known as free vibration. There will be periodic fluctuations around the system’s equilibrium points. You can divide systems into two categories: continuous and discrete.
Physical attributes in a discrete system are discrete quantities, and ordinary differential equations characterize the system’s behavior. As opposed to continuous systems, which have an infinite number of degrees of freedom since their physical attributes are a function of spatial coordinates and partial differential equations represent their behavior, this system has a finite number of degrees of freedom.
A discrete system has its entire mass concentrated at a few locations, while a continuous system distributes its mass along its entire length. Linked differential equations govern natural frequencies. Discrete systems have finite natural frequencies, while continuous systems have an infinite number. Under free vibration, the system will vibrate once or more of its inherent frequencies, which are determined by its mass and stiffness distribution.
Apparatus
- Base
- Carriage
- Adjuster
- Helical spring
- Guide roller
- Additional mass
- Guide columns
- Mechanical recorder
- Ruler
Procedure
To determine the spring constant. Fit the paper and remove the weight from the carriage. Using the adjustment. Briefly start the recorder after each weight is added. Stepped curved will be obtained from which the individual steps can be read.
To determine the natural frequency, Fit the plotter pen, attach the chosen additional mass, and secure it with a knurled nut. Use the adjuster to set the height of the carriage so that the stylus is centered on the paper. Start recording, deflect the carriage downwards by hand, and allow it to oscillate freely until it comes to rest. Stop the recorder and repeat the experiment with other additional mass.
Results
Table 1: Load/Mass vs Deflection/Extension

Discussion
The purpose of both parts of the experiment was to calculate the spring constant, k. The first part of the experiment was carried out with no paper in the plotter and no paper in the machine. Once the baseline was established, we added 2 kg to the carriage and took another reading. The next step was to increase the weight of the carriage by 2 kg, bringing the total to 10 kg.
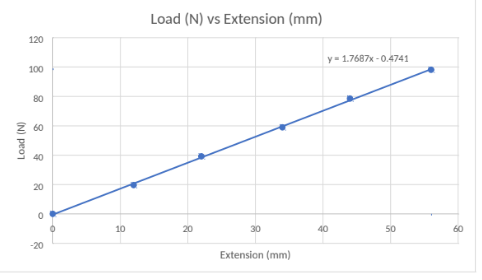
The information was recorded each time a load was positioned. As seen in the table below, there was a one-to-one relationship between the load applied and the spring’s resulting displacement. The experimental value of the gradient was 1.769 N/mm, which was obtained from the graph. The experimental result for the spring constant is somewhat different from its predicted value of 1.710 kN/m.
The second portion of this experiment involved measuring the spring’s inherent frequency in hertz. The experiment was first performed without any weight on the carriage. However, the 1.25 kg mass of the frame was taken into account while concluding (Hamrat et al., 2020).
The carriage was lifted to 50, as shown in table 1 above. At the same time that the machine was turned on, the carriage was dragged down by hand using a certain amount of force, as shown in Figure 1 above. The information was recorded and shown as a graph on that computer.
Conclusion
In conclusion, the spring constant, k, can be calculated from the graph we constructed since the gradient of the graph is equal to k. More effort is needed to extend a spring of a given length if its spring constant (k) is larger than the effort needed to stretch a less stiff spring of the same length. If we ignore it, we can determine the spring’s natural frequency.
The natural frequency value of a system is one of its most crucial characteristics. The spring’s natural frequency is determined by the total mass of the spring and the beam’s rigidity. This experiment is consistent with Hooke’s Law because the load did not affect the spring constant, and the spring’s natural frequency is directly proportionate to the load. Natural frequency and spring displacement will both be affected by the applied load.
References
Hamrat, M., Bouziadi, F., Boulekbache, B., Daouadji, T. H., Chergui, S., Labed, A., & Amziane, S. (2020). Experimental and numerical investigation on the deflection behavior of pre-cracked and repaired reinforced concrete beams with fiber-reinforced polymer. Construction and Building Materials, 249, 118745. Web.
Schellhammer, S. M., Gantz, S., Lühr, A., Oborn, B. M., Bussmann, M., & Hoffmann, A. L. (2018). experimental verification of magnetic field‐induced beam deflection and Bragg peak displacement for MR‐integrated proton therapy. Medical Physics, 45(7), 3429-3434. Web.