Initial Commentary on the Selected Chart
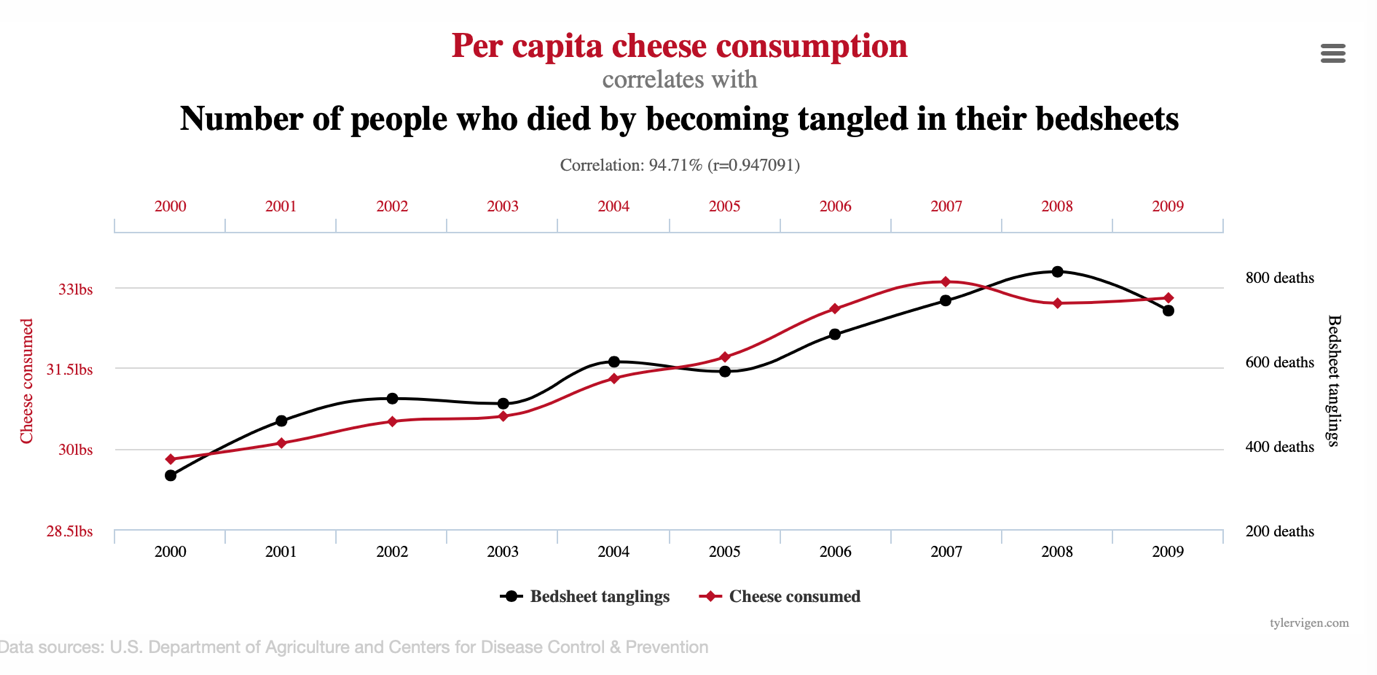
Correlation studies refer to the study of the relationship between two continuous variables, the purpose of which is to determine the strength and direction of the relationship. Strictly speaking, Pearson’s correlation coefficient is ranked from -1.0 to +1.0, and depending on the numerical value and the sign in front of the number, this determines a strong, weak, moderate, or no positive or negative correlation. For this paper, I chose two variables that I found particularly interesting to discuss: per capita cheese consumption and the number of people who died while tangled in sheets, as shown in the Figure below (Vigen, 2023).

Potential Causative Link Between the Variables
The visualization of the relationship between the two variables shown in the figure makes one think of an upward trend: over time, both variables showed an almost linear increase (on average). My initial impression of the data was that the relationship might seem random: the apparent correlation may not be valid, but it is random.
However, the chart also shows a calculated correlation score of r =.947, indicating a strong positive relationship. This leads to speculation as to why these two variables might be related at all. On the one hand, one could speculate that people who frequently eat cheese in bed may tangle in their sheets and die. On the other hand, high cheese consumption leads to obesity, which, in the context of clumsiness and low physical activity, can lead to ridiculous deaths.
Correlation Without Causation: An Alternative Perspective
However, it is worth noting that the calculated statistics only respond to the strength and direction of the association but cannot be used to construct causal relationships. In other words, the apparent correlation may have absolutely no physical explanation, even though the r-value is high. Thus, this example refers to the case of Spurious correlation when there may be no logical explanation for the observed relationship.
Reference
Vigen, T. (2023). Spurious correlation. Tyler Vigen. Web.