Executive summary
A business report is an ordinarily and objective communication of factual information that serves a business report. There are two types of business report such as the shorter or informal forms and the long or formal forms. It is one kind of formal report. There are various steps in the preparation of business report such as
- planning the investigation and the report
- securing data through bibliographical research
- securing data through questionnaires
- securing data through interviews and other research methods
- analyzing and interpreting data and
- out line up the report.
In every business report, there is necessary to determine problem. There are four steps to determine problem such as
- analyzing of the situation
- analyzing of the problem
- analyzing the reader and
- defining and limiting the problem.
Starbucks is an international coffeehouse and it is the biggest and largest company in the world. It runs its business in 44 countries with 16226 stores. It sells drinks, coffees, ice cream and so on food items. It has also entertainment division where the company markets books music and film. In addition, Starbucks markets its coffee through grocery stores and licenses its brand for other food and beverage products (SmartBrief, 2008).
This study will analyze the portability, liquidity, activity and leverage condition of the Starbucks Corporation based on its financial data. At fast this study will analyze various related data with profitability and liquidity and then will interpret the analyzed data to identify weather there is any problem on profitability and liquidity management or not. If it has, this study will give a suggestion to over come this problem.
List of Illustrations
MS
FIN
NWC
EBIT
return on investment (NA)
return on investment (TA)
Table of Contents
- Title: Business Report about Starbucks
- Executive summary
- List of Illustrations
- Table of Contents
- Introduction
- Body of the Report
- The consolidated Statement of Earnings
- The Consolidated Balance Sheet
- The analytical calculation of financial data
- Conceptual Description
- Interpretation of the analytical data
- Liquidity analysis
- Profitability analysis
- Activity Analysis
- Leverage Analysis
- Summary
- Recommendations
- Conclusion
- Appendix
- Index
- References
Introduction
The Starbucks Company markets their product through many popular grocery chains in United States and Canada. The total grocery chains are 15011 worldwide as of November 2007. It was established in 1971 by three partners and their first store was in Pike Place Market where the sold high quality coffee beans and equipment. The Starbucks Company markets various products worldwide such as brewed coffee, hot chocolate, espresso, teas, Frappuccinos, Naked Juice, San Pellegrino, Izze soda and Horzon Organic Milk and so on (Starbucks! My Life, n.d.).
The Starbucks are available in Argentina, Australia, Austria, Bahamas, Bahrain, Brazil, Canada, Chile, China, Cyprus, Czech Republic, Denmark, Egypt, France, Germany, Greece, Hong Kong, Indonesia, Ireland, Japan, Jordan, Kuwait, Lebanon, Macau, Malaysia, Mexico, Netherlands, New Zealand, Oman, Peru, Philippines, Puerto Rico, Qatar, Romania, Russia, Saudi Arabia, Singapore, South Korea, Spain, Switzerland, Taiwan, Thailand, Turkey, United Arab Emirates, and the United Kingdom, as well as the United States.
The business report about Starbucks’ portability and liquidity management and activity and leverage management will be given through analytical forms. It is done to identify the quality of Starbucks’ liquidity and profitability management and activity and leverage with the help of related factual information from financial statements in 2006, 2005 and 2004. This study will take help of ratio analysis for the analysis and interpretation of data.
Body of the Report
The financial statements of the Starbucks are very important sources of information and the consolidated income statements and the consolidated balance sheet are given below.
The consolidated Statement of Earnings
In thousands expect earning per share
The Consolidated Balance Sheet
In thousands, except share detail.
The analytical calculation of financial data
Conceptual Description
Portability means the firms ability to earn maximum profit through effectiveness and efficiency by utilizing the firms’ current and fixed assets. The more utilization of assets is the more profit. The liquidity means the firms ability to meet the current obligation of firm by its current assets. It depends upon the relation of current assets and current liabilities. The more current assets than current liabilities are the more liquidity.
On the other hand the more current assets are the less profit because some portion will be ideal which can help to earn profit. Hence the more liquidity is the less profitability and the more profitability is the less liquidity. There is a conflict between liquidity and profitability (Roussakis, 1997, p. 234). To enjoy maximum profit with maximum liquidity, the firm must make an adjustment between the profitability and liquidity. Prager (1971) states that “[w]hen there is conflict between safety and profitability, it is better to err on… between safety and profitability is the conflict between liquidity” (p.24).
Funds of creditors and shareholders are invested in various assets to operate the business and to generate the sales and profit. The proper high management if these assets help to increase the amount of sales. The activity will be measured in this study with the help of activity ratio and the activity ratios are used to evaluate the efficiency and effectiveness by which the company utilize and manage the assets. The activity ratios are related with sales and assets.
Leverage is the power of a company to use its fixed expenses (fixed operating expenses and fixed financial expenses), so that the company can earn more than its cost which helps to increase the overall profitability of the company. Hence the use of fixed charge sources of funds, such as debt and preference capital along with the owners’ equity in the capital structure is discussed as leverage and it is examined in this study with the help of leverage ratio. Hence a company will be a successful company when it can enjoy the maximum advantages from liquidity, portability, activity and leverage power.
Interpretation of the analytical data
Liquidity analysis
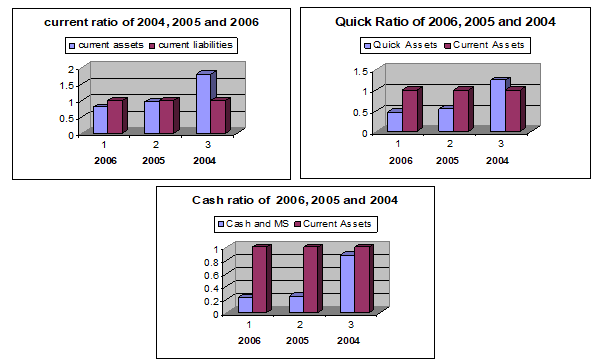
The current ratio is the measure of short term solvency. It indicates the availability of current assets to pay the currant liabilities. In 2004, the current assets were over the currant liabilities but in 2005 and 2006 the current liabilities were less then the current liabilities and it was decreasing from 2005 to 2006 and this is the indicator of weak sort term solvency.
The quick ratio is a relationship between quick assets and current liabilities and the quick assets means the assets which can be converted into cash immediately without any loss of value and it also the indicator of liquidity. In 2004, the quick assets were over the current liabilities but in 2005 and 2006 it was not satisfactory.
The cash ratio was also satisfactory in 2004 but in 2005 and 2006 it was decreasing since the cash and marketable securities are the most liquid assets, that’s why the company must have sufficient cash to operate the business operation smoothly but if the company has the bowering power in the short time, it is not a matter of worried.
The working capital was positive in 2004 but in 2005 and 2006 it was negative which is never desirable and because of it the company’s operating activities may be affected badly.
From the above analysis, this study wants to say that the overall liquidity position of the Starbucks Company was on the way of unfavorable for the company.
Profitability analysis
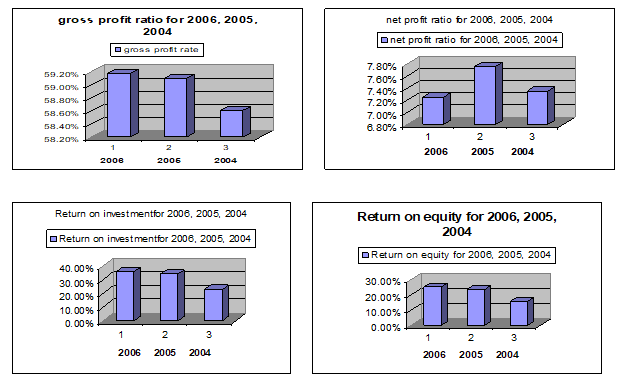
The gross profit margin is the reflection of the efficiency with which the management produces every of product. Subtracting the gross profit margin from 100 percent, the rate of cost of goods sold can be determined. A high gross profit margin reflects the efficient and effective goods management and it may be occurred due to higher sales prices or lower cost of goods sold or a combination of sales price and costs (Hardy and Meech, 1925).
The lower gross profit margin is due to higher cost of goods sold because of company’s inability to purchase raw materials at favorable terms, inefficient utilization of plat of and machinery or over investment in plant and machinery.
The gross profit margin was on the way of improvement because it was increased year by year. The net profit margin reflects a relationship between net profit and sales and it indicates the company’s efficiency and effectiveness in manufacturing, administrating and selling the products. The net profit margin of the Starbucks was on a stable position and it was also on the way of improvement. The operating expenses ratio, the return on investment, the return on equity and the earning per share was satisfactory in 2005 and 2006 but in 2004 it was not on the satisfactory position.
From above calculation and analysis of the financial data, this study wants to say that the profitability of the company was satisfactory and it was on the way of improvement.
Activity Analysis
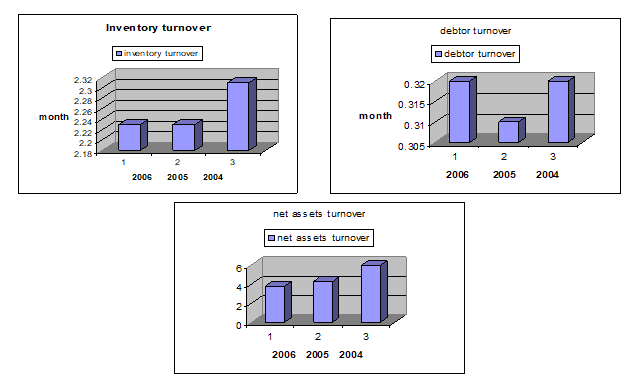
Inventory turnover indicates the efficiency of the firm in producing and selling its product. It shows that how quickly the inventory is converting into receivable through sales. High inventory turnover indicates the good inventory management than low inventory turnover. In the Starbucks Company the inventory turnover that means the holding period of inventory was lower in 2006 and 2005 than 2004. It indicates that the company’s inventory management was on the way of improvement.
The debtor turnover indicates the efficiency of credit management and a high debtor shows the efficient credit management. In the Starbucks Company, the debtor turnover that means the holding period of debtor was so low which indicates the good credit management.
Assets are utilized to generate sales so a firm should manage its assets effectively and efficiently as a result it can maximize its profit. The net assets turnover, the total assets turnover, the fixed assets turnover and the current assets turnover was improving year by year. It was the indicator of good assets management by which the Starbucks Company maximized its earning per share year by year.
Leverage Analysis
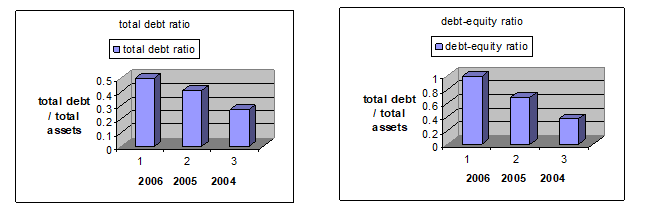
The total debt ratio is a relation between total debt and total assets. With the help of it, how much assets come from the debt can be known. In the Starbucks Company, the total liabilities comparing the total assets were increasing year by year which indicates that it had high ability to collect lone from the money market. Assets come from liabilities and owners equity. Hence there is a necessary of combination in debt and equity in the capital structure.
The Starbucks Company’s debt was increasing year by year that means the company was facing high financial risk as a result the company increased its earning per share year by year. In 2004, the company had 28% total debt comparing total assets but in 2005 and 2006 it was 41% and 50% respectively. That means the company faced more financial risk which helps to increase it return on equity.
Summary
Starbucks Corporation is an international coffee and coffeehouse chain based in Seattle, Washington (STARBUCKS vs. DUNKIN’ DONUTS, n.d.). This study tries to intend to make a business report on its overall financial conditions comparing various financial data from the consolidated income statement and the consolidated balance sheet as Starbucks is the largest coffeehouse company in the world with 15,012 stores in 44 countries.
To analyze the financial data, three years financial statements are used in this study. In the Starbucks Corporation, the profitability condition was satisfactory because the most of the profitability ratios’ results were in favor of the corporation and the profitability was increasing year by year, but the net profit ratio shows that in 2006 it was decreased it was because of the high operating costs so the management should have to minimize the operating as far as possible.
The activity ratio was some unfavorable in 2004 but in 2005 and 2006 it was increasing that means the company managed its various assets effectively that’s why the company’s profitability was increased which will be clear in the portability section..the various types of profitability ratio of the Starbucks Company were increased year by year which helped to increase the total assets of the company over the year. As a result the company’s per share revenue was increased. The liquidity position of the company was not satisfactory. In 2004, the company’s short term solvency was satisfactory but in 2005 and 2006 it was too much unfavorable for the company and the company’s net working capital was negative. Hence the company was operating its business smoothly except its liquidity management.
Recommendations
Since the Starbucks Corporation faced the liquidity problem in 2005 and 2006 and the profitability problem (net profit) in 2006 the must take some initiative steps to improve the liquidity position. This study wants to recommend the following suggestion:
- the company should manage the working capital effectively because the working capital management refers to the administration of all aspects of current assets, namely cash, marketable securities, debtors and stock and current liabilities.
- the company should follow combination the various types of financing ways of current assets such as long term financing, short term financing and spontaneous financing and should follow the matching approach for the current assets management.
- the company should forecast the required current assets and then take initiative steps to manage current assets with currant liabilities.
- the company should adjust the profitability and liquidity condition and also follow the portfolio management in case of profitability and liquidity management.
- for increasing the net profit condition, management should consider the operating costs and the fixed financial cost which helped to also decrease it.
- the corporation should take into consideration the credit management because the debtor turn over shows that in 2006 it was higher holding period which is indication of low credit management.
Conclusion
This study made a business report about Starbucks‘s financial [position based in the fiscal year 2006 comparing the fiscal year 2005 and 2004. This study identifies a problem in the company’s financial position. The company’s profitability, activity and leverage condition was good in 2004, 2005 and 2006. But the company’s liquidity position was not good in 2005 and 2006 that’s why this study wants to say that the Starbucks Corporation should emphasis on the liquidity management which helps to maximize the corporation wealth and to manage an optimum profitability and liquidity management.
Appendix
Since the Starbucks Corporation faced liquidity problem, the various liquidity ratios’ chart are given below which helps to understand the liquidity position of the Starbucks Corporation

The charts of various profitability ratio helps to understand the profitability condition of the Starbucks Corporation, which maximize the shareholders wealth.

To know the activity condition of the Starbucks Corporation, the charts help to more clearly understand that condition.

To know the leverage condition of the Starbucks Corporation, the following leverage ratio’s charts help to more clearly understand.

Index
- Coffeehouse, 19
- Leverage management, 19
- Liquidity, 4, 10, 19
- Liquidity management, 19
- Profitability, 4, 11, 19
- Profitability management, 19
- Starbucks Corporation, 2, 13, 14, 15, 16, 17, 19, 20
- Starbucks markets, 2, 19
References
SmartBrief, (2008). Starbucks Corporation: Company Overview. Web.
Prager, Jonas. (1971). Monetary economics: controversies in theory and policy. the University of Michigan: Random House.
Roussakis, Emmanuel N. (1997). Commercial Banking in an Era of Deregulation: Third Edition, Praeger.
Hardy, C. O. and Meech, S. P. (1925). Analysis of Financial Statements. The University Journal of Business, Vol. 3, No. 4, pp. 378-396.
STARBUCKS vs. DUNKIN’ DONUTS — Coffee WARS. (n.d.). Web.
Starbucks! My Life!. (n.d.). Starbucks CEO confident about turnaround. Web.