Updated:

Sukuk Data: Public Sukuks, Issuance by Industry Coursework

Exclusively available on Available only on IvyPanda® Made by Human No AI

Introduction

This is a report with information on different Sukuks (Islamic bonds). It shows historical data, bid prices and ask prices (ALCLICK, 2009). The information shall be useful for comparison of different Sukuks.

Public Sukuks
CodeNameTypeAskBidClosingPrevious ClosingChange
High or Low
Last TradedTrade PeriodBond (Maturity)
1AdibAbu Dhabi Islamic Bank Sukuk CompMusharaka99.99099.99099.99099.7000.29
0.29 %
99.99021/10/201112/12/2011
2bmai.snBMA International SukukIjara87.00085.50087.000100.000-13.000
-13.00 %
87.00023/03/2010
3CbbiscCentral Bank of BahrainIjara110.000109.125109.125109.1250.000

0 %

109.12525/09/201117/06/2014
4daar.snDAAR International SukukIjara92.75092.00092.00099.750-7.750

-7.77 %

92.00015/05/2011
5DanagsDana Gas SukukMudarabah0.00094.75094.75094.7500.000
0 %
94.75025/09/201104/10/2012
6DararkDar Al-Arkan International SukukAl-Wakala Bel-Istithmar95.00093.00093.00093.500-0.500
-0.53 %
93.00025/09/201118/02/2015
7dewaDEWA Funding LimitedIjara99.25098.75098.75098.7500.000
0 %
98.75025/09/20112013
8dugbDubai DOF Sukuk LimitedIjara104.625103.875103.875103.8750.000
0 %
103.87525/09/201128/10/2014
9dugb 6.396Dubai DOF Sukuk LimitedIjara105.125104.625104.625104.6250.000
0 %
104.62525/09/201128/10/2014
10EibEIB Sukuk Company LtdMusharaka99.00098.50098.50098.5000.000
0 %
98.50025/09/20112012
11emaa.snEmaar Properties SukukIjara103.375102.250102.250102.2500.000
0 %
102.25025/09/20112016
12emiratEmirates Airline SukukMusharaka0.00098.50098.50099.250-0.750
-0.76 %
98.50025/09/201115/06/2012
13GeGE CAPITAL SUKUK LTDIjara104.500104.000104.000104.0000.000

0 %

104.00025/09/201127/11/2014
14IdbIslamic Development BankAl-Wakala Bel-Istithmar105.750105.250105.250105.2500.000
0 %
105.25025/09/201116/09/2014
15jafz.snJebel Ali Free Zone FZEMusharaka77.00075.00077.00076.5000.500

0.65 %

77.00023/06/2009
16nakhlNakheel SukukIjara0.000114.250114.250114.2500.000

0 %

114.25024/07/2011
17petrolPETRONAS Global Sukuk LtdIjara106.410106.070106.070106.0700.000

0%

106.07025/09/201112/08/2014
18qgsq.snQatar Global Sukuk QSCIjara100.05099.850100.050100.0000.050

0.05 %

100.05023/03/2010
19QIB.skQatar Islamic Bank Sukuk Ltd.104.000103.500103.500103.5000.000

0 %

103.50025/09/201110/2015
20RaksRakia Sukuk Co LtdIjara0.000109.000109.000109.0000.000

0 %

109.00025/09/201110/12/2012
21scsi.snSarawak Corporate Sukuk Inc.Ijara100.00099.500100.00099.5000.500

0.50 %

100.00006/12/2009
22SibSharjah Islamic Bank SukukMusharaka100.00099.85099.85099.8500.000

0 %

99.85025/09/201110/2012
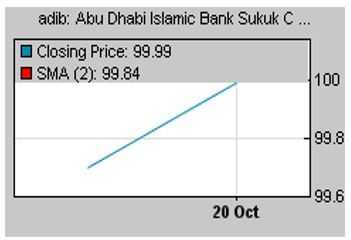
Abu Dhabi Islamic Bank Sukuk Company: (adib): Top Sukuk gainer
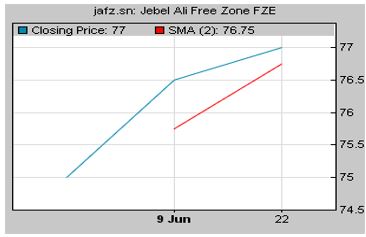
Jebel Ali Free Zone FZE: (jafz.sn): Biggest Sukuk Loser

Components of the Dow Jones Citigroup Sukuk Index, 2008

NameCoupon*MaturityCountryParQuality
Dubai Global Sukuk3.33311/04/2009UAE1000A+
Sarawak International4.28212/22/2009Malaysia350A-
Islamic Development Bank3.30206/22/2010Supranational500AAA
State of Qatar4.41610/09/2010Qatar350AA-
Abu Dhabi Islamic Bank3.21912/12/2011UAE800A
Dubai Islamic Bank3.53403/22/2012UAE750A
Emirates Islamic Bank3.11906/12/2012UAE350A
Dubai International Financial Centre3.19406/13/2012UAE1250A+
National Industries Group Sukuk3.85708/16/2012Kuwait475BBB
DP World Sukuk Ltd.6.25007/02/2017UAE1500A+

Source: Citigroup Index LLC., November 2008

*Amount in US $ Millions

Sukuks Issuance by Industry

Source: Dow Jones, 2008

IndustryVolume
(US$—millions)
% Total VolumeOfferings% Total OfferingsAverage Issuance
(US$—millions)
Financial Services21,712.9224.7%6911.6%314.68
Real Estate19,368.7322.0%6711.2%289.09
Transport12,004.6313.6%406.7%300.12
Power & Utilities9,054.7710.3%223.7%411.58
Oil & Gas6,338.127.2%203.4%316.91
Government7,340.658.3%19733.1%37.26
Construction4,254.044.8%345.7%125.12
Services2,088.672.4%71.2%298.38
Telecoms & IT1,836.322.1%284.7%65.58
Industrial Manufacturing1,090.301.2%213.5%51.92
Conglomerates1,014.881.2%71.2%144.98
Agriculture & Food767.550.9%528.7%14.76
Consumer Goods347.640.4%111.8%31.60
Mining & Metals306.650.3%40.7%76.66
Basic Materials169.100.2%71.2%24.16
Healthcare128.080.1%30.5%42.69
Automotive127.510.1%61.0%21.25
Travel & Tourism4.690.0%10.2%4.69

Shari’ah Structure

Issuances by Type of Shari’ah Structure

Source: Dow Jones, 2008

Structural TypeVolume
(US$—millions)
% Total VolumeOfferings% Total OfferingsAverage Issuance
(US$—millions)
Ijarah29,567.0733.7%22537.8%131.41
Musharaka27,339.0131.2%7813.1%350.50
Modarabah10,305.3711.8%335.5%312.28
Murabaha8,065.009.2%11218.8%72.01
Istisnaa5,022.205.7%162.7%313.89
Al-Istithmar4,332.874.9%40.7%1083.22
Al Salaam2,337.732.7%12621.2%18.55
Other650.000.7%10.2%650.00

From January 1997 to November 2008

Source: Dow Jones, 2008

Approximately $87,955.22 million of sukuks have been issued pursuant to 596 offerings
Sovereign35%
Corporate65%
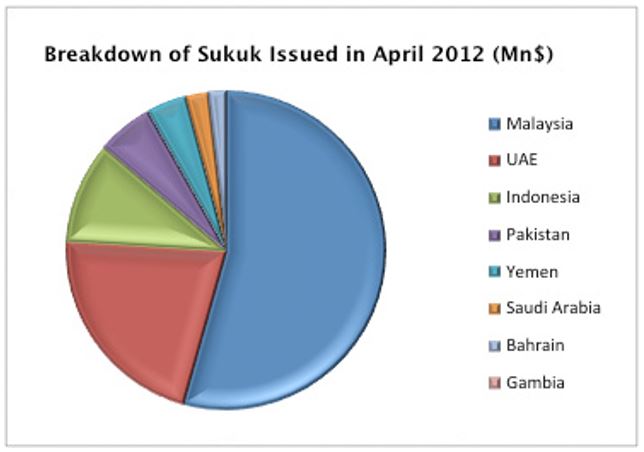
Malaysia267 issuances44.80%
Bahrain150 issuances25.17%
By volume
Malaysia($37,696.72 million42.86%
The United Arab Emirates$26,977.48 million30.67%
Gambia$36 million6.04%
Saudi Arabia$8,224.629.35%
Average issuance size
The UAE$793.46 million
Malaysia$141.19 million
Bahrain$41.56 million
Global Sukuk Issuances by Issuance Status
International SukukDomestic Sukuk
S/No.Issuer StatusVolume(USD in
Million)
Percent of
Total Volume
Volume(USD in
Million)
Percent of Total
Volume
1Sovereign1455431%5264535%
2Quasi Sovereign30006%32912%
3Corporate3031163%9384163%

Source: IIFM dated 29/03/2010

Tenor

Tenor is an imperative factor in the sukuk market as a tool for raising Islamic capital markets. Therefore, it is a source of concern for market players.

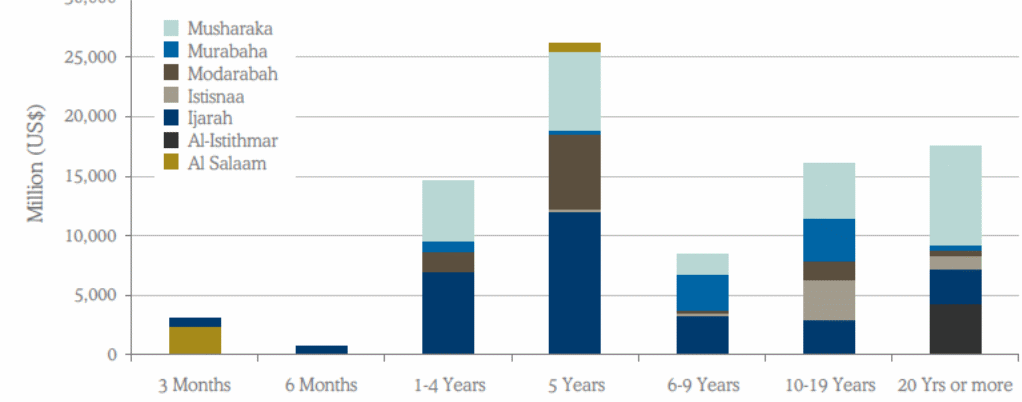
According to Dow Jones, only 3.69 percent of the total issuances have a tenor of over 20 years or more. This represents only 19.8 percent of the issuance volume.

Long-term tenure has 16.44 percent (the period is more than 10 years). This represents 38.1 percent of the issuance volumes. This cannot favor countries’ development needs. For instance, the need for infrastructure development and other long-term financial needs require $21.7 trillion by 2014.

Source: Dow Jones, 2008
Long-term CategoryPeriodPercent
Triads
Mushāraka20 years and over
10 years and over
63.64%
52.04%
Mudāraba
Murābaha
Second category
Ijāra20 years and over13.64%
10 years and over31.63%
Third
Istisna’a9.09% by number20 year and over
6.60% by volume
13.27% by number10 years and over
13.58% by volume
Tenor and Shariah Structure by Number of Issuance
Tenor and Shariah Structure by Dollar Volume

The most common form of tenor is the medium-term. From the above charts, we have the following observations:

  • Five-year tenors have 18.79 percent in numbers and 31.2 percent of the total sukuks issued
  • Five to nine year tenors have 45.13 percent of total issuances
  • One to nine year tenors constitute 53.42 percent of the total of issuances, which represent 58.48 percent by volume
  • Five to 19 year tenors are 47.82 percent and 59.2 percent in terms of numbers and volumes respectively
  • Medium-term implies issuance between one to 19 years of tenor. They represent 55.03 in terms of numbers and 75.9 percent by volume
StructureTenor
Medium-term
NumbersVolumes
Murbaha
One to nine years28.71 percent8.70 percent
Five to nine years31.60 percent9.71 percent
Six to nine years50.96 percent35.91 percent
Note: maybe revolving or working capital facilities
Majority maybe metal commodities or commodities not sealable in the secondary markets
IjaraOne to ten years45.19 percent44.99 percent
One to 19 years43.81 percent33.82 percent
Note: Ijara are common in most tenure and look stronger in the mid-term categories

Industry Statistics

Source: Sukuk Monitor, 2013

Secondary Market Prices, 2013

Zawya CodeSukuk NameProviderCurrencyBid PriceAsk PriceBid/Ask YieldLast Updated (GMT)
ADCB.SKADCB SukukSJS MarketsUSD106.613107.2792.24/ 2.06305 Feb 13 10:02
CBBINTL3.SKCBB International Sukuk 3SJS MarketsUSD114.443115.4173.494/ 3.32205 Feb 13 07:55
DPWORLD.SKDP World SukukSJS MarketsUSD110.939111.5573.542/ 3.39905 Feb 13 07:59
EIB2.SKEmirates Islamic Bank Sukuk (2017)SJS MarketsUSD105.041105.7313.343/ 3.16105 Feb 13 08:12
FGB2.SKFGB Sukuk (Tranche 2)SJS MarketsUSD105.685106.3442.522/ 2.35205 Feb 13 08:17
HBME.SKHBME SukukSJS MarketsUSD104.599105.2862.131/ 1.92205 Feb 13 08:20

Source: Web.

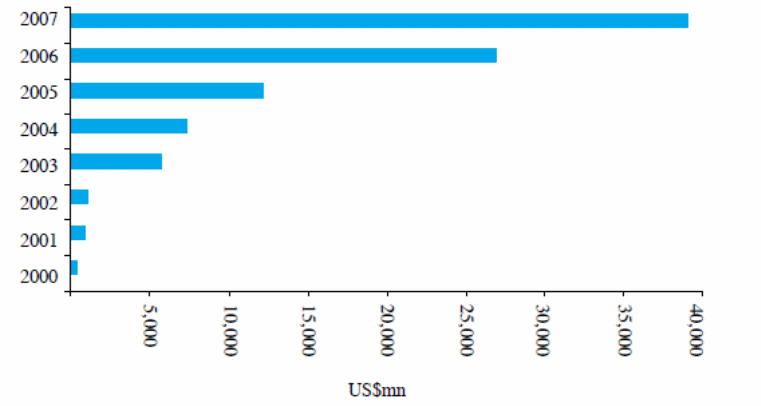
The Sukuk market gained strength in 2002. The Malaysian government issued sukuks, which were worth US$600 million. This development in the sukuk market occurred because of sovereign benchmark issues. These figures grew steadily by 40 percent within six months in 2007.

About 36 percent of the issuances came from Asia, specifically Malaysia, Brunei, and Pakistan. The GCC contributed about 62.1 percent between 2001 and 2007.

Between 2001 and 2007, the UAE led in the issuance of sukuks with regard to sizes. It issued 36.2 percent of the total world Sukuks issued during that period.

During the same period, Malaysia contributed 32.1 percent sukuks issued between 2001 and 2007. This implies that Malaysia was the largest player in the issuance of sukuks. This represented 137 issues while the UAE issued 29.

Sukuk markets have grown exponentially. However, it faces several challenges related to economic conditions, regulatory, and legal issues. This observation considers Shariah compliant provisions. These trends are common in any emerging security markets.

However, there are efforts from Islamic regulators to control such problems. These regulators include the Accounting and Auditing Organization for Islamic Financial Institutions, the International Islamic Financial Market, and the Islamic Financial Services Board.
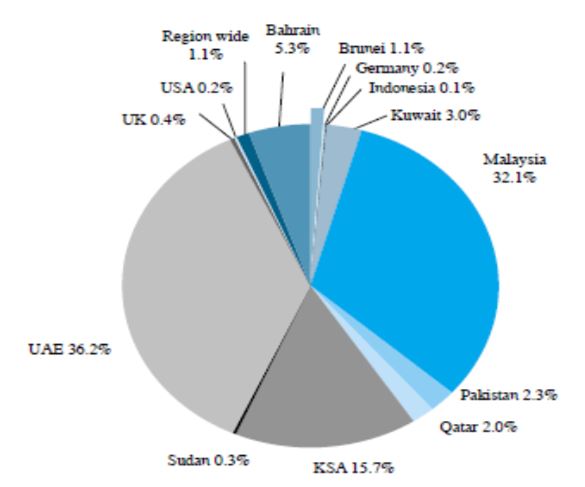
International Sukuks Issuance (2001 to 2007). Source: Zawya, 2007
International Sukuks Issuance (2001 to 2007). Source: Zawya, 2007
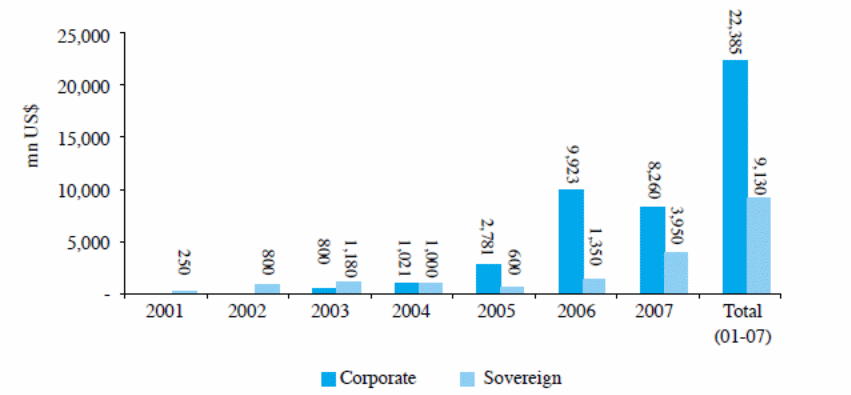
  • Corporate issuances have demonstrated strong and rapid expansion since 2001. This includes both public and private issuances.
  • The value rose from USD0.4 billion in 2003 to USD9.9 billion in 2006. This represents a growth of 2,380.7 percent.
  • Malaysia issued most of the Shariah-compliant corporate sukuks. This was about 90 percent in 2004.
  • Most corporate issues take the form of quasi-sovereign. Sovereign natures of the risk behind these sukuks drive investors’ actions.

Annual Issuance in Tenor Categories by Number of Issuances

OfferingsPre-200120012002200220042005200620072008
3 Months000000313119
6 Months000004121112
1-4 Years0122357914
5 Years01371224103124
6-9 Years15581746252525
10-19 Years422154142024
20 Years or more100001686
Total691218378477117224

Source: Dow Jones, 2008

Corporate and Sovereign Sukuks issued, 2001 to 2007. Source: Zawya, 2007
Corporate and Sovereign Sukuks issued, 2001 to 2007. Source: Zawya, 2007
Source: McKinsey and Company, World Islamic Banking Competitiveness Report, 2007 to 2008
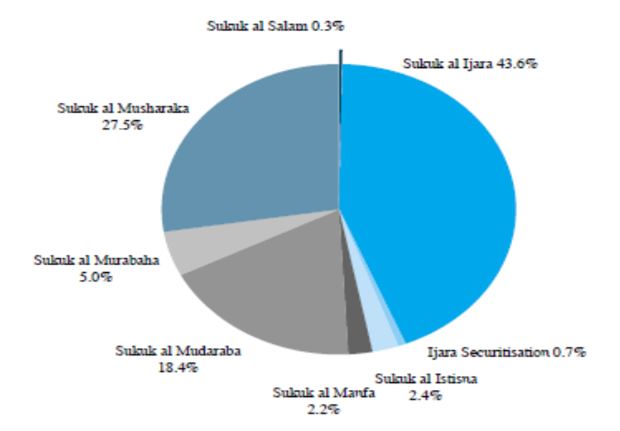
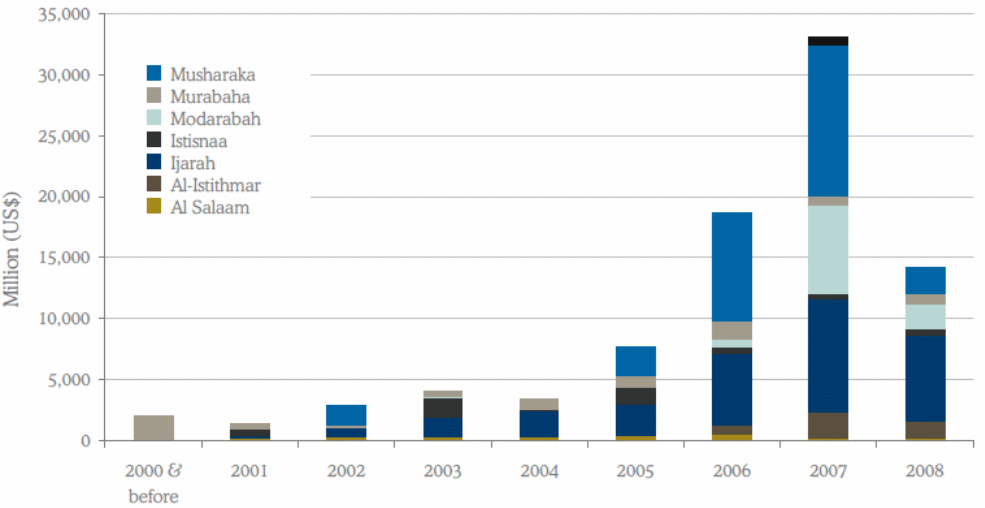
Types of International Sukuks issued, 2001 to 2007. Source: Zawya, 2007
Types of International Sukuks issued, 2001 to 2007. Source: Zawya, 2007

Major Managers of sukuk securities: 2001 year to September 2005

ManagerAmount US$Issues% Share
CIMB1,3234720.7
HSBC1,2241819.1
Aseambankers531398.3
AmMerchant Bank506507.9
Standard Chartered316284.9
Citigroup30014.7
Dubai Islamic Bank28324.4
Deutsche Bank27534.3
EON Bank246473.8
RHB Bank201453.1

Source: Islamic Finance News, 2005

YearSR interest ratesSaudi non-oil GDP
growth
RM interest ratesMalaysian GDP
growth
19996.144.205.005.00
20006.674.302.508.60
20013.923.502.800.30
20022.234.202.704.20
20031.633.402.755.20
20041.735.702.707.10
20053.537.402.705.20
Mean3.694.673.025.08
SD1.901.310.812.39

Sources: Saudi Arabian Monetary Agency and Bank Negara, Malaysia, 2005

Dow Jones Islamic Market Indexes Performance Report* in part based on back tested performance, 2008

INDEX1 MONTHYTD1 YR3 YR5 YR
Dow Jones DFMTitans 10 Index-25.56-58.282578.123463.56180.24
Dow Jones-JS Pakistan Islamic Index3.2-43.89551.639255.3416994.72
Dow Jone Islamic Market Amana Sri Lanka Index-8.2-20.82855.3931.711080.15
Dow Jones Islamic Market Asia/Pacific Index-4.58-47.93813.68852.771562.73
Dow Jones Islamic Market Asia/Pacific Titans 25 Index-6.47-41.11296.491386.122201.22
Dow Jones Islamic Market BRIC Index-11.11-64.08931.231047.582592.21
Dow Jones Islamic Market China Offshore Index1.62-63.331273.91253.623473.73
Dow Jones Islamic Market Europe Titans 25 Index-4.52-42.851637.051714.492864.54
Dow Jones Islamic Market GCC Index-19.39-50.121269.761575.112545.59
Dow Jones Islamic Market Hong Kong Index-1.81-56.22788.73803.291801.53
Dow Jones Islamic Market India Index-8.5-67.68758.24828.72346
Dow Jones Islamic Market Indonesia Index-14.29-70.89424.43495.21457.83
Dow Jones Islamic Market Islamic Market Japan Index-0.77-37.03810.8817.11287.53
Dow Jones Islamic Market Kuwait Index-12.47-40.951024.421170.411734.9
Dow Jones Islamic Market Malaysia Index-0.76-49.81911.39918.351815.73
Dow Jones Islamic Market Philippines Index8.94-45.911151.611057.152128.93
Dow Jones Islamic Market Singapore Index-1.51-57.21641.45651.311499.19
Dow Jones Islamic Market South Korea Index-16.18-60.46380.03453.41961.17
Dow Jones Islamic Market Taiwan Index-13.65-49.622404.722784.914773.51
Dow Jones Islamic Market Thailand Index-2.28-56.93794.52813.091844.74
Dow Jones Islamic Market Titans 100 Index-3.81-35.21700.261767.692623.91
Dow Jones Islamic Market Turkey Index-5.54-55.061935.532049.134306.6
Dow Jones Islamic Market U.S. Titans 50 Index-3.14-30.671797.031855.312591.96
Dow Jones Islamic Market World Emerging Markets Index-10.82-561082.811214.132461.06
Dow Jones Islamic Sustainability Index-5.98-40.491750.691862.132942.08

Regional break-up of the Domestic Sukuk Market

CountryVolume (US$ millionsNo. of Issues% of Total Value
Asia
Malaysia67,87279266.8%
Indonesia1,923481.9%
Pakistan1,657311.6%
Brunei740130.7%
Singapore9920.1%
GCC
Saudi Arabia7,665107.5%
UAE7,151107.0%
Bahrain1,508771.5%
Qatar13710.1%
US, Europe and Africa
US16710.2%
Germany12310.1%
Gambia0.38810.0%
Sudan12,6142012.4%
Total101,6561,007100.0%

Source: IIFM 1st edition, 2010

Recent Corporate Sukuk Issues in the GCC

IssuerDIB Sukuk CompanyNakheel DevelopmentJAFZ Sukuk
Type of SukukSukuk MusharakaSukuk IjaraSukuk Musharaka
Purpose of IssuanceBuying of assets as per
business agreement
Buying of assets as per
business agreement
Buying of assets as per
business agreement
Issue SizeUS$750 millionUS$3.52 billionDH7.5bn (US$2.4 billion)
Margin/Profit RateLibor + 0.33%Libor + 1.2%EIBOR + 130bps
Listing Date26thMarch 200714thDecember 200607thDecember 2007

Source: Zawya, 2008

For the Year International Market Global Market

For the YearInternational MarketGlobal Market
200491.0%86.1%
200571.6%69.8%
2006147.1%104.4%
200776.1%89.2%
20086.8%15.9%
2009*8.5%19.4%
CAGR106.8%88.3%

Source: IIFM Sukuk issuance Database, 2010

The following table provides the current fixing rate and return payment details for Sukuks, which are administered by LMC and is prepared for the benefit of Sukuk investors.

Last Updated 25 Aug 2008

Current Rate Fixing + Margin (%)Rate Fixing DatePrevious Rate Fixing + Margin (%)Total Return FormulaReturn Payment DatesMaturity Date
Short Term Sukuk Centre
US$ 268MM
5.102512-Dec-075.0451m LIBOR+ Variable SpreadMonthly17-Jan-08
Govt. of Bahrain – BMA (Issue #7)
US$ 250MM
5.4562523-Nov-075.986m LIBOR+ 0.60%27-May
27-Nov
27-May-08
EMAAR
US$ 65MM
3.833-July-085.173756m LIBOR+ 0.70%06-Jan
06-Jul
6-Jul-09
Durrat Al Bahrain Sukuk
US$ 152.5MM
4.0523-July-084.173m LIBOR+ 1.25%25-Jan
25-Apr
25-Jul
25-Oct
25-Jan-10
The Commercial Real Estate Sukuk
US$ 100MM
4.079-Nov-076.01256m LIBOR+ 1.25%12-May
12-Nov
12-May-10
Al Marfa’a Al Mali Sukuk
US$ 134MM
5.29524-Jul-085.406883m LIBOR+ 2.50%26-Jan
26-Apr
26-Jul
26-Oct
26-Jul-10
Lagoon City Sukuk US$ 200MM5.3837526-June-086.96756m LIBOR + 2.25%28-Dec
28-Jun
28-Dec-11
Berber Sukuk
US$ 130MM
9.5Fixed Rate19-Sep
19-Mar
19-Sep-14
Thani Investment Sukuk
US$ 100MM
5.0393820-March-087.606256m LIBOR + 2.50%26-Sep
26-Mar
26-Sep-12

Source: Web.

The following table provides the details of Sukuk trades executed by LMC in the Secondary Market:

Last Updated 27 March 2007

Executed Trades for 2007 (US$ 55,500,000)
Trade DateTrade TypeName of SukukSukuk Return / Tenor
22-Mar-07BuyA’ayan First Sukuk Co.6m LIBOR + 2.00% / 5 Years
13-Mar-07SellEmaar3m LIBOR + 0.70% / 5 Years
7-Mar-07BuyQatar Real Estate Investment Company Sukuk6m LIBOR + 1.20% / 10 Years
6-Mar-07BuyLagoon City Sukuk6m LIBOR + 2.25% / 5 Years
1-Mar-07BuyLagoon City Sukuk6m LIBOR + 2.25% / 5 Years
21-Feb-07SellPakistan Int’l Sukuk6m LIBOR + 2.20% / 5 Years
21-Feb-07BuyPakistan Int’l Sukuk6m LIBOR + 2.20% / 5 Years
13-Feb-07BuyLagoon City Sukuk6m LIBOR + 2.25% / 5 Years
12-Feb-07SellLagoon City Sukuk6m LIBOR + 2.25% / 5 Years
31-Jan-07SellAl Marfa’a Al Mali3m LIBOR + 2.50% / 5 Years
31-Jan-07BuyAl Marfa’a Al Mali3m LIBOR + 2.50% / 5 Years
23-Jan07SellLagoon City Sukuk6m LIBOR + 2.25% / 5 Years
16-Jan-07SellCommercial Real Estate Sukuk6m LIBOR + 1.25% / 5 Years
11-Jan-07SellLagoon City Sukuk6m LIBOR + 2.25% / 5 Years
Executed Trades for 2006 (US$ 113,000,000)
Trade DateTrade TypeName of SukukSukuk Return / Tenor
14-Dec-06SellEmirates Airlines Sukuk6m LIBOR + 0.75% / 7 Years
8-Oct-06SellSharja Islamic Bank Sukuk6m LIBOR + 0.65% / 5 Years
3-Oct-06SellWings FZCO6m LIBOR + 0.75% / 5 Years
3-Oct-06BuyWings FZCO6m LIBOR + 0.75% / 5 Years
3-Oct-06SellDGSI3m LIBOR + 0.45% / 5 Years
3-Oct-06BuyDGSI3m LIBOR + 0.45% / 5 Years
2-Oct-06BuyDurrat Al Bahrain3m LIBOR + 1.25% / 5 Years
24-May-06BuyEmaar Ijara Sukuk6m LIBOR + 0.70% / 5 Years
12-Jul-06SellAl Marfa’a Al Mali3m LIBOR + 2.5% / 5 Years
12-Jul-06BuyAl Marfa’a Al Mali3m LIBOR + 2.5% / 5 Years
6-Jul-06SellAl Marfa’a Al Mali3m LIBOR + 2.5% / 5 Years
6-Jul-06BuyAl Marfa’a Al Mali3m LIBOR + 2.5% / 5 Years
3-Jul-06SellAl Marfa’a Al Mali3m LIBOR + 2.5% / 5 Years
3-Jul-06BuyAl Marfa’a Al Mali3m LIBOR + 2.5% / 5 Years
8-May-06BuyAmlak Finance6m LIBOR + 1.2% / 5 Years
27-Apr-06BuyPCFC7.125 – 10.125 % / 2 Years
6-April-06SellCommercial Real Estate Sukuk6m LIBOR + 1.25% / 5 years
31-Mar-06BuyTabreed5.5% fixed
31-Mar-06SellAl Marfa’a Al Mali Sukuk3m LIBOR + 2.5% / 5 years
30-Mar-06SellDubai Civil aviation6m LIBOR + 0.45% / 4 years
28-Mar-06SellDubai Civiaviation6m LIBOR + 0.45% / 4 years
28-Feb-06SellAl Marfa’a Al Mali Sukuk3m LIBOR + 2.5% / 5 years
29-Jan-06SellGovt. of Bahrain – BMA (Issue #12)Fixed 5.6% / 6 Years
29-Jan-06BuyGovt. of Bahrain – BMA (Issue #12)Fixed 5.6% / 6 Years
03-Jan-06SellThe Investment Dar Sukuk6m LIBOR + 2.0% / 5 years
Executed Trades for 2005 (US$ 60,900,000)
Trade DateTrade TypeName of SukukSukuk Return / Tenor
29-Dec-05BuyThe Investment Dar Sukuk6m LIBOR + 2.0% / 5 years
29-Dec-05SellDubai Civil Aviation Sukuk6m LIBOR +0.45% / 5 years
14-Dec-05BuyEmaar Ijara Sukuk6m LIBOR + 0.7% / 5 years
14-Dec-05SellEmaar Ijara Sukuk6m LIBOR + 0.7% / 5 years
01-Nov-05SellThe Investment Dar Sukuk6m LIBOR + 2.0% / 5 years
31-Oct-05BuyThe Investment Dar Sukuk6m LIBOR + 2.0% / 5 years
03-Oct-05SellAl Marfa’a Al Mali Sukuk3m LIBOR + 2.5% / 5 years
03-Oct-05BuyAl Marfa’a Al Mali Sukuk3m LIBOR + 2.5% / 5 years
06-Sep-05BuyCommercial Real Estate Sukuk6m LIBOR + 1.25% / 5 years
29-Aug-05SellAl Marfa’a Al Mali Sukuk3m LIBOR + 2.5% / 5 years
29-Aug-05BuyAl Marfa’a Al Mali Sukuk3m LIBOR + 2.5% / 5 years

Source: Web.

The following list is sorted in alphabetical order with LMC administered Sukuk at the top:

Last Updated 7 May 2008

IssuerMaturity DateReturnIssue Size (Source currency MM)Issue
Size (US$’MM equivalent)
Rating/
Listing
Indicative PriceIndicative
Spread to
LIBOR /
SWAPS (bps)
Size
($ MM)
BidOfferBidOfferBidOffer
Lagoon City Sukuk12-Dec-116m LIOBER+ 2.25%USD 200200CI: BBB+99.50100.00224250
Al Marfa’a
Al Mali (Corporate)
26-Jul-103m LIBOR + 2.50%USD 13413499.75100.35261237
Durrat Al Bahrain Sukuk (Corporate)25-Jan-103m LIBOR + 1.25%USD 152.5152.599.00100.00173125
Emaar (Corporate)6-Jul-096m LIBOR + 0.7%USD 656599.25100.2511850
The Commercial Real Estate Sukuk (Corporate)12-May-106m LIBOR + 1.25%USD 100100CI: A-99.00100.001681245
Govt. of Bahrain – BMA (Issue #7)27-May-086m LIBOR + 0.60%USD 250250S&P: A- /
Bahrain
100.12100.3540-5
Short Term Sukuk
Centre (Corporate) *
Monthly
17-Jan-08
5.1025USD 2682681055
* Backed by a pool of publicly offered Sukuk
IssuerMaturity DateReturnIssue Size (Source currency MM)Issue
Size (US$’MM equivalent)
Rating/
Listing
Indicative PriceIndicative Spread to LIBOR / SWAPS (bps)Size ($ MM)
BidofferBidOfferBidOffer
Amlak Finance (Corporate)18-Jul-106m LIBOR + 1.20%USD 20020099.00100.00198124
PCFC Sukuk
(Govt)
23-Jan-08Fixed 7.18%USD 3,5003,500117.00117.75
Dubai Global Sukuk
(Govt)
4-Nov-096m LIBOR + 0.45%USD 10001000Govt. rating applicable99.75100.3560285
Wings FZCO15-Jun-126m LIBOR + 0.75%USD 550550Luxembourg99.70100.3584683
Gold Sukuk DMCC
(Corporate)
6-May-106m LIBOR + 0.6%USD 200200CI: A-99.00100.25103502
Solidarity Trust (ISDB)12-Aug-083.625% fixedUSD 400400S&P: AAA Fitch: AA / Lubuan & Luxembourg99.0099.20336
IDB Trust Services (ISDB)22-Jun-10LIBOR + 0.12%USD 500500S&P: AAA Fitch: AA /
Luxembourg, Lubuan & Bahrain
99.65100.15298
Tabreed (Corporate)2-Mar-095.5% fixedUSD 100100Luxembourg99.00100.00183104
Qatar Real Estate Inv. Co.8-Aug-163m LIBOR + 1.20%USD 270270100.25101.25117100
Ayan First Sukuk Co.20-Sep-116m LIBOR + 2%USD 10010099.70100.50224182
NICBM Sukuk (Corporate)18-Oct-11LIBOR +1%USD 10010098.0099.00175139

Source: Web.

Main observations from various sukuks

  • The data reveal that there is a great demand for sukuks since 2001
  • There should be sound Shariah laws to manage the sector
  • Malaysia has the most active sukuks
  • The sector needs right frameworks of laws, regulations, and legal systems to support the growth
  • Most comprehensive data cover periods between 2001 and 2008

Reference

ALCLICK. (2009). Sukuk information and Sukuk market data. Web.

More related papers Related Essay Examples
Cite This paper
You're welcome to use this sample in your assignment. Be sure to cite it correctly

Reference

IvyPanda. (2022, May 11). Sukuk Data: Public Sukuks, Issuance by Industry. https://ivypanda.com/essays/sukuk-data-public-sukuks-issuance-by-industry/

Work Cited

"Sukuk Data: Public Sukuks, Issuance by Industry." IvyPanda, 11 May 2022, ivypanda.com/essays/sukuk-data-public-sukuks-issuance-by-industry/.

References

IvyPanda. (2022) 'Sukuk Data: Public Sukuks, Issuance by Industry'. 11 May.

References

IvyPanda. 2022. "Sukuk Data: Public Sukuks, Issuance by Industry." May 11, 2022. https://ivypanda.com/essays/sukuk-data-public-sukuks-issuance-by-industry/.

1. IvyPanda. "Sukuk Data: Public Sukuks, Issuance by Industry." May 11, 2022. https://ivypanda.com/essays/sukuk-data-public-sukuks-issuance-by-industry/.


Bibliography


IvyPanda. "Sukuk Data: Public Sukuks, Issuance by Industry." May 11, 2022. https://ivypanda.com/essays/sukuk-data-public-sukuks-issuance-by-industry/.

If, for any reason, you believe that this content should not be published on our website, please request its removal.
Updated:
This academic paper example has been carefully picked, checked and refined by our editorial team.
No AI was involved: only quilified experts contributed.
You are free to use it for the following purposes:
  • To find inspiration for your paper and overcome writer’s block
  • As a source of information (ensure proper referencing)
  • As a template for you assignment
1 / 1