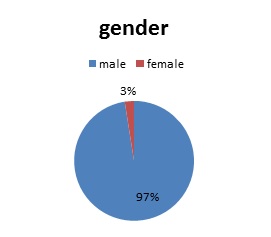
Gender
Among the participants in the interview, there was only one female and 39 male. This translates to 97% of the participants being males and 3% being females.
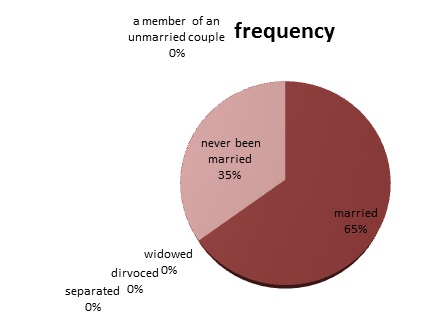
Current marital status
When the participants were asked about their marital status, most of them were married (65%) while the never-married were 35%. It appears that most of the participants were not separated, widowed, divorced or members of an unmarried.
Age group
As shown in the table below, most of the people surveyed (42.5%) using services were aged between 36-45 years while those aged 25-35 were 35%. Those under age 25 were 17.5% and only 5% were aged between 46-55. There were no participants aged between 46-66 and over 60 who used the services.
Primary language and level of education
From the data in the table above 14 of the participant were high school leavers or had an equivalent where 5 were Arabic speakers, 3 English users, another 3 Asian language users, 2 African language users, and the other 2 used other tongues. Trade certificate holders were three with two speaking Arabic and one English. Those with a bachelor’s degree were 14, were by eight were conversant with the Arabic language, 1 English, 3 Asian, two were users of other languages and none was speaking any of the African languages. Those of post-graduate degree holders were six with four who were Arabic language users and two who used other languages. The rest had other qualifications and among them, two were conversant with Arabic as one was eloquent in an African language. From the statistics above, it is clear that the services provided at auburn community accommodated people of all cultures.
Working status
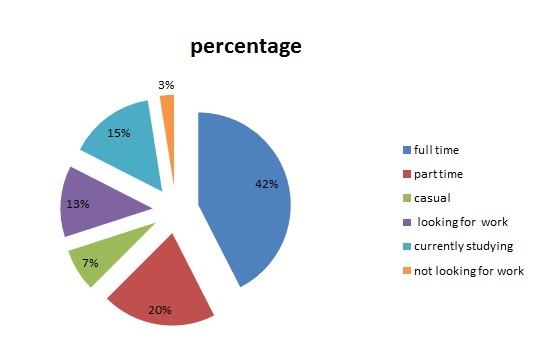
Most of the participants were working classes where 42.5% had full-time jobs, 20% were part-time workers, and 7.5% were casual workers. The remaining 30% had no employment because some of them stated that they were looking for work, studying, or not looking for a job. The table above shows the normal distribution of the responses.
Duration lived in Auburn and whether they had families in Australia
Most of the participants had families or friends in Australia, only two had no friends or family and had lived in Auburn between 1-5 years. Out of 38 who had friends or family in Australia 3 had lived in Auburn in less than a year, 13 had lived in Auburn between 1 to 5 years, 14 participants, 1 participant and 7 had lived in Auburn between 6 to 10 years, 11 to 15 years and more than 16 years.
States lived most
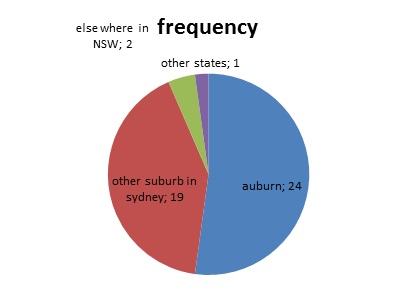
Most participants stated that they had lived in Auburn or other suburbs in Sydney. The pie chart below shows where the participants had lived more. From this chart, it can be observed that only one had lived in other states, two had lived mostly in NSW, 19 in other suburbs in Sydney, and 24 in Auburn.
Region of origin, duration of stay in Australia, and relationship with neighbors
Most of the participants came from the Middle East, followed by those from Asia, African participants were eight, and from other arrears, they were eight. Out of 16 participants from the Middle East, two had come to Australia less than a year ago, one had stayed between 1 and 5 years, while those who had stayed between 6 to 10 years and 11-15 years were three participants each, and seven participants had stayed for more than 16 years. Looking at the 5 participants from Africa, 1 had come to Australia less than a year ago, 2 had stayed between 1 and 5 years, while those who had stayed between 6 to 10 years were 1 participant, 1 participant had stayed for more than 16 years. Out of 11 participants from Asia, those who had stayed between 6 to 10 years and more than 16 years were one participant each, six had stayed between one, and 5 years and three participants had stayed for 11-15 years ago.
Duration of stay and relationship with neighbors
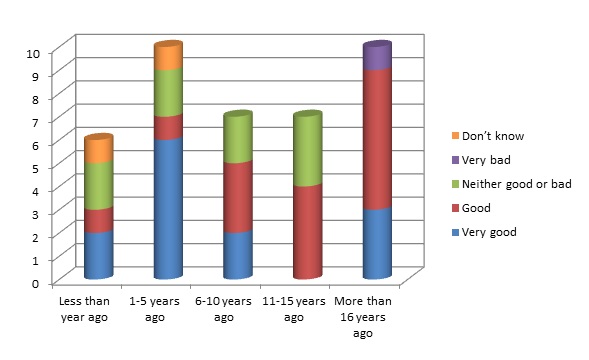
13 of the participants had a very good relationship with their neighbors whereas 2 had lived less than a year, 6 had stayed between 1-5 years, 2 had stayed between 6-10 years, and had for over 16 years. The table above shows the relationship with neighbors and the duration of stay.
Relationship and country of origin cross table
Positive aspects of living in Auburn
When asked about positive aspects that attracted them to live in Auburn most (26) chose social environment, 14 of them stated social events as a positive aspect, 12, 11, 5 and 3 of the chose restaurants, shopping, sports events, and medical services/hospital as positive aspects respectively. While Youth services, neighborhood center, / youth drop-in activities, local service providers/organizations, and other aspects were chosen by four participants each as positive aspects that influenced them to live in Auburn. It can be observed that two had child protection/ childcare as a positive aspect, this may be because most of them came as students before engaging in other activities.
Negative aspects of living in Auburn
From the graph below, it can be noted that traffic (17), crime (14), noise (13), and employment services (10) were considered great negative aspects that discourage the participants from living in Auburn.
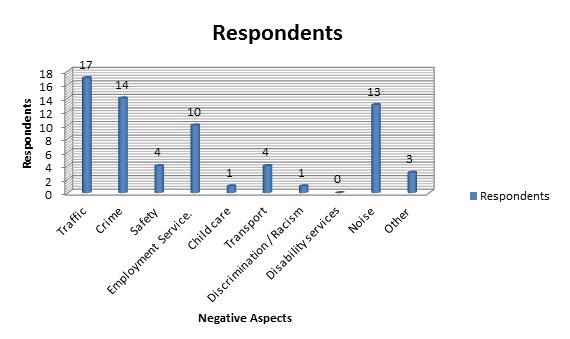
The other negative aspects such as safety (4), childcare (1), transport (4), discrimination, / racism, and other (3) had less than five participants. Disability services appeared to an aspect with little consequence as none of the participants chose it. The table below gives frequencies:-
How frequent usage of services available in Auburn
The table below shows how the participants patronized services. Daycare and transport services appear to attract participant use daily while other services had their frequency usage varying.
Duration of stay and the most important of these services
The participants were asked about the most important services to them and their families, Doctor (27), social events (15), transport (14), library (13), parks and leisure (10), and Sporting activities (10) had many participants who frequently required the services. Other services had less than five participants. Those who had stayed many years in Australia appeared to use services such as daycare, attend festivals and events. The table below shows how the surveyed respondent.
Most important of these services and country of origin
Accessibility to the services
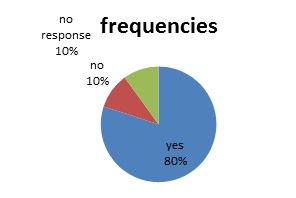
As the study shows, there is easy access to the Doctor, Social events, Daycare, Mother’s group, Childcare services, Youth programs and activities, Transport Parks and Leisure, Library, Venues and Facilities, Festivals events and Sporting activities as evidenced by the 80% of the people who participant positively. A few, of 10% said that the facilities and services were inaccessible, as the rest (10%) did not give any response.
The barriers to accessing these services
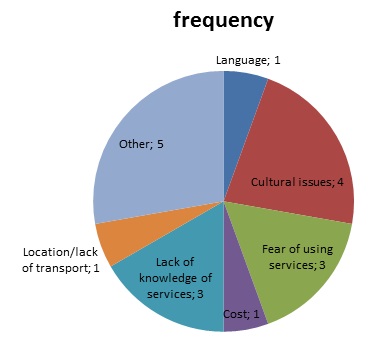
There is an expectation of obstacles to any service provision whereby the providers try as they can to limit or rather to reduce its negative effects to the customers. Therefore, Auburn being a normal society, community services are not exempted from the common barriers. The barriers to these services include fear of using the services due to poor orientation and ignorance, cultural issues where some cultures restrict usage or reception of some services. The cost of the services can limit the number of people who are likely to benefit from it due to economic discrimination. Finally, language barriers and inadequate knowledge of the services can too contribute to the limited usage of the services. The table above shows the normal frequency distribution of the responses received during the study. The chart below shows the distribution of participants
