Scenario 1
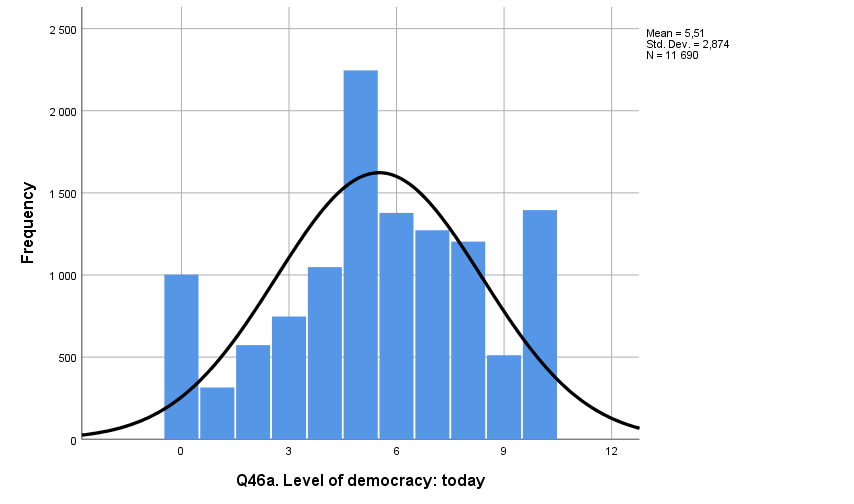
According to the statistical analysis using data from the Afrobarometer dataset (mean of Q1 = 37.24), perceptions about the current level of democracy in Africa are significantly different from six (p = 0.000). One sample t-test was used to compare the mean value of Q46a variable (level of democracy today) to six. The mean perceived level of democracy in Africa was 5.51 (SD = 2.87), which was found significantly different from the preferred value of 6. However, the effect size of the difference is small. The effect size for a one-sample t-test can be calculated by dividing the mean difference by the standard deviation. Thus:

According to Sullivan and Feinn (2012), the effect size of 0.2 and below is considered very small. Thus, even though there is a significant difference between the desired perceived level of democracy and the actual perceived level of democracy, the difference is small. The results have implications for social change, as they show the governments that the level of perceived democracy is slightly below the desired value, which means that reforms are needed to improve it. However, the situation is not an emergency, and the governments can take their time planning reforms. The SPSS output is provided in Figures 1 and 2 below.


As demonstrated in the figures above, a one-sample t-test was used to compare the mean of Q46A to six. This type of test is used when the sample mean needs to be compared to the population mean (Siedlecki & Bena, 2021). The assumptions for the test include normality of distribution, absence of outliers, and independence of observations (Siedlecki & Bena, 2021). Additionally, the variables should be either continuous or scale-type (Siedlecki & Bena, 2021). The data fits all the assumptions, as all the observations were independent, and Q46A is a scale variable. There are no significant outliers, as the range is 1-10. The normality was tested by creating a histogram, which demonstrated that the data is normally distributed (see Figure 3 below). Therefore, the use of a one-sample t-test was appropriate in the situation.

Scenario 2
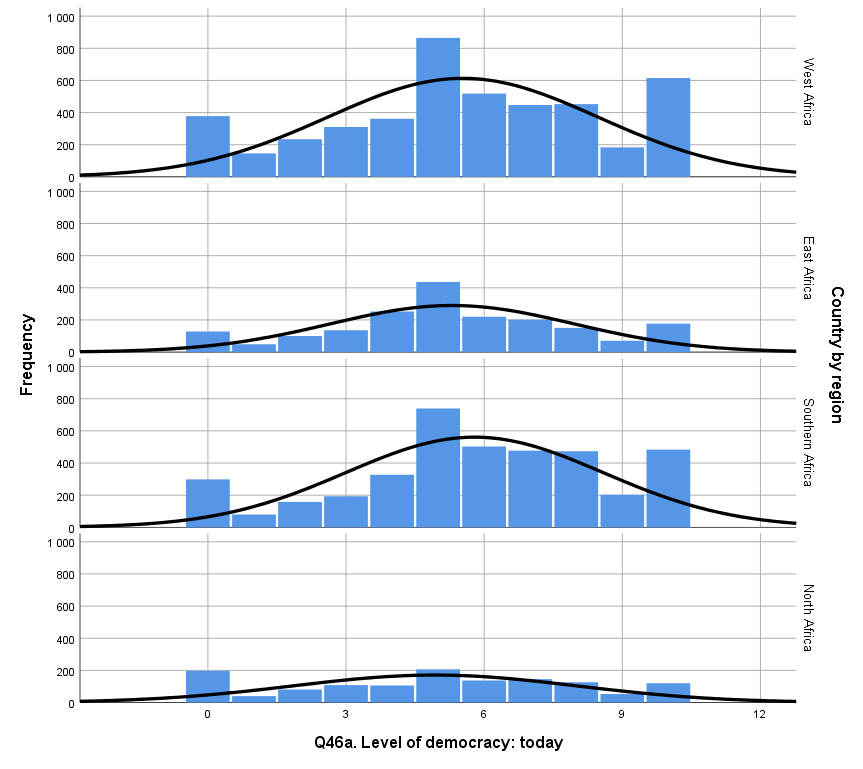
Afrobarometer dataset ((mean of Q1 = 37.24) was used to answer the question provided in the second scenario. Statistical analysis revealed there was a significant difference (p = 0.000) between the mean perceived level of democracy in Northern Africa and the mean perceived level of democracy in Southern Africa. The mean perceived democracy level in Northern Africa was 4.93 with an SD of 3.08, which was significantly lower than the mean perceived democracy level in Southern Africa, which was 5.79 with an SD of 2.8. The effect size (Cohen’s d) for the difference is 0.3, which stands for small effect size (Sullivan & Feinn, 2012). Thus, even though the differences between the means are significant, they are small. As an implication for social change, countries from Northern Africa can improve their level of democracy by learning from countries in Southern Africa. However, their ability to learn is limited, as the differences between the two regions in terms of the level of democracy is small. The SPSS output for the scenario is provided in Figure 4 and 5 below.


As seen from the figures above, an independent sample t-test was used to answer the research question. According to Siedlecki & Bena (2021), independent-sample t-tests are used to determine the difference in means of a dependent variable in two independent groups, which is appropriate for the purpose of the present analysis. The data meets all the assumptions, as all the observations were independent, a scale was used to measure the variables, the distribution was close to normal, and the variances were equal. The normality was assessed by examining the histograms provided in Figure 6. Levene’s test for equality of variances demonstrated that the variances between two samples were equal with p = 0.000 (see Figure 5). Thus, the use of an independent-sample t-test was justified.

Scenario 3
In order to answer the research question, the HS Long Study Dataset (mean of X1SES = 0.0545) was used. A paired-sample t-test was used to compare observations of X2MTHUTI and X3MTHUTI. Siedlecki & Bena (2021) state that a paired-sample t-test should be used to understand if the differences between two paired observations were significantly different from zero. The assumptions of the test include that groups contain matched pairs of data, each pair is independent, and each subject contributes only one pair of data (Siedlecki & Bena, 2021). Thus, the use of the test was appropriate as all the assumptions were met based on the description of the dataset.
The results of the analysis revealed that there were no significant changes in students’ perception of math’s utility between their freshman year and senior year (p = 0.786). The SPSS output is provided in Figures 7 and 8 below. The results have implications for social change, as they demonstrate that high school students’ perception of math utility is not affected by grade. Therefore, interventions to improve the perceived utility of math in US high schools are equally needed on all grade levels.


Reference
Siedlecki, S., & Bena, J. (2021). What you need to know about running and interpreting the t-test. Clinical Nurse Specialist, 35(2), 56-61.
Sullivan, G. M., & Feinn, R. (2012). Using effect size—or why the P value is not enough. Journal of graduate medical education, 4(3), 279-282.