Introduction
Coca-Cola, being one of the sponsors for the London Olympic Games 2012, has great plans to capture a large of the Olympics market. Therefore, the task of the paper is to create a demographic profile of the spectators at the Olympics. This paper will also help in developing a product for Coca-Cola in order to target one specific group. This paper will show the major factors that affect the price elasticity of demand for Coca-Cola during major events like the Olympics. Further, the paper will show how the demand for the product will increase due to advertising.
Demographic Profile
This analysis of the demographic profile is based only on UK residents. The data is gathered from the Food Survey of 2008 (DEFRA, 2008). If the demographic group is divided on the basis of age then the expenditure on soft drink consumption on three years average (from 2006 through 2008). The demographic pattern will be dealt with on basis of age, income, household composition, and region. The demographic profile by age is provided in figure 1.
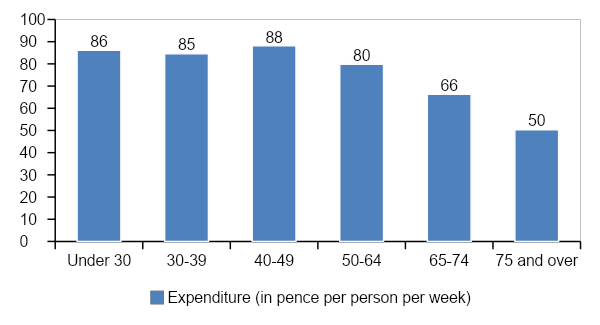
The consumer expenditure and purchase of soft drinks by age are shown in figure 1. The data shows that the age group does the maximum purchase of soft drinks in quantities 40-49 years. Overall the largest amount of soft drink purchase and expenditure is done by the people under 50 who spend the most pence per person per week on soft drink consumption.
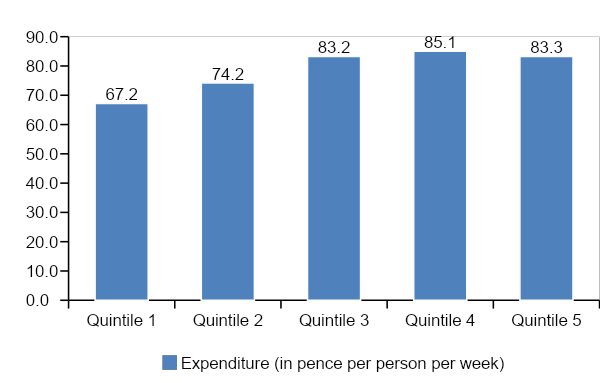
Figure 2 shows the expenditure of the households on basis of income and their expenditure in average pence per week. Here, quintile 1 represents the lowest and quintile 5 represents the highest income group. This shows that the people who spend the maximum on a soft drink with income group belonging to quintile 3 and 4 i.e. middle and upper-middle-class income group. Therefore, overall the largest three quintiles spend the maximum amount on soft drinks per person per week.
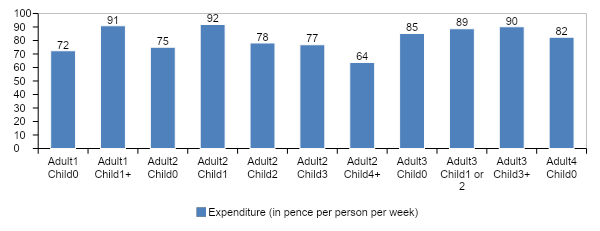
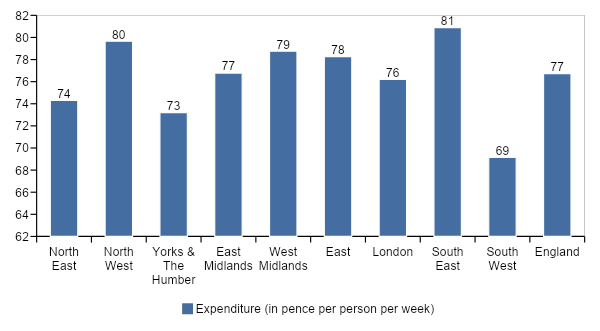
Figure 3 shows that the families, which have children, have the maximum consumption of soft drinks in the UK. As figure 3 shows, any family with 2 more adults and 1 or more children has the maximum expenditure on soft drinks. The average weekly expenditure per person on soft drinks is found to be maximum in England, North West, and West Midlands.
Coca-Cola may launch a new range of carbonated sorts of energy drinks during the Olympics game. The target customer for Coca-Cola during the Olympics would be people under 50, with income belonging to middle or upper-income level, and belonging to a household with at least one child. The target profile is presented in figure 5. The figure shows the preference of these target profiles in terms of the nature of the soft drinks. Here we consider four types of soft drink – low calorie concentrated non-concentrated and not low calories concentrated and non-concentrated.
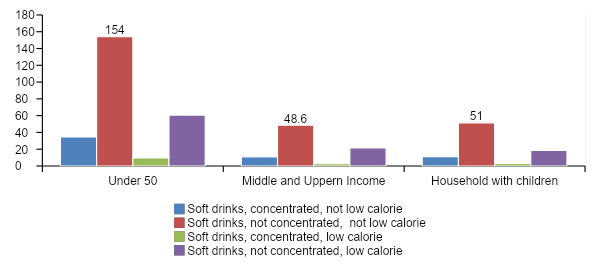
The graph shows that the best product that Coca-Cola can launch for this particular target group is not-concentrated non- low calories soft drinks. This may be a new line of carbonated energy drinks, which has the largest appeal to the customers. Further, as it will be summers, this product with its unique rehydrating quality will appeal more to the customers.
Factors Affecting Price Elasticity of Demand
Substitues
Coca-Cola being one the sponsor of the game, will have the maximum exposure and will not have any close substitute like Pepsi or others like fruit juice etc. at the sports venues. However, one of the biggest substitutes for Coca-Cola will be water, tea, coffee, fruit juices, etc. Olympics are being held in the summers. As the climate is expected to be moderately warm, the demand for soft drinks will be high as a cool beverage.
Income Elasticity
For our target group, the average weekly income per week per household is found to be £550. The average expenditure of the households, which are actually targeted by Coca-Cola, spends 0.15 percent of their income on soft drink consumption. Given this expenditure of the product of the household on soft drinks, the question arises is that if it is a necessary or a luxury good? On observing the figure 2, it can be said that soft drinks’ income elasticity changes with income of the household. When the household’s income is below quintile 4, there is an increase in consumption of soft drink with income.
However, at higher income levels, with rise in the income, consumption expenditure falls, therefore, indicating negative income elasticity. For this, the necessary indicator is income elasticity of demand. This can be found from the ratio of percentage change in consumption expenditure and the percentage change in consumption. On calculating the income elasticity of soft drinks in the UK, it was found that the average income level for quintile 1 is £14,300, for quintile 3 it is £3200 and that for quintile 5 is £5200 (ONS, 2010).
On calculating the income elasticity at lower quintiles, it was found that for income level below quintile 4 the income elasticity is 0.21 indicating that soft drink is a normal good. However, for income above quintile 4, the income elasticity becomes -0.04 implying that soft drinks become inferior good for households with higher income level. This implies that when the target customers are people below the income level of quintile 4, the product will be consumed more.
Increase in inbound International Tourists
The other factor that will affect the price elasticity of demand during the Olympics games is the increase of tourists during the Olympics. As there will be increased tourists, apart from the residents of the country, this will increase the demand for the product. Therefore, an increase in tourists to the Olympics will also boost the sale of Coca-Cola.
Change in Demand
A large amount of advertising revenue will be spent by Coca-Cola in order to gain brand exposure during the Olympics games. What will be the effect of an increased advertisement on demand for the product? Becker & Murphy (1993) show that advertisement and the products are complementary goods, and therefore an increase in the cost of producing one of the goods will increase the demand for the other good.
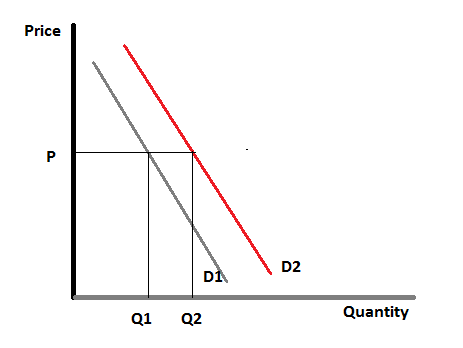
Higher expenditure into advertising to gain positive exposure and promotion will boost demand for a product. This will boost the demand for soft drinks during the Olympics, and will also boost overall demand. As figure 6 shows with increased advertisement and brand exposure to the consumers directly at the event sites, will increase the demand for the product. This will increase the overall market demand for Coca-Cola during the Olympics Games, in the UK as well as the rest of the world.
This is so because the brand will be advertised as a sponsor of the event through media coverage. This, therefore, will shift the demand curve of Coca-Cola from D1, which was its original demand curve, to D2, which is the increased demand curve for Coca-Cola due to advertisements. Thus, for the same price of soft drinks at P, the demand will increase from Q1 to Q2.
Conclusion
Olympics will pose great opportunities for Coca-Cola. As this will increase the demand for the product during the game in the UK, it will also increase demand for the product through promotions as a sponsor of the sporting event through wide coverage in international media. Further, for the UK, the report found that Coca-Cola should target people in the middle-income group, as the product becomes an inferior good in the higher-income households.
Further, the target group of Coca-Cola should be individuals below 50 years. In terms of households, the household should be in the middle-income level, with at least one child. Moreover, the product that the company should introduce is a carbonate, non-concentrated, not low-calorie energy, or sports drink. This product will have a higher appeal due to the involvement in the sporting event.
References
Becker, G.S. & Murphy, K.M., 1993. A Simple Theory of Advertising as a Good or Bad. The Quarterly Journal of Economics, 108(4), pp.941-64.
DEFRA, 2008. Family Food – Datasets. Web.
ONS, 2010. Household Incom. Web.