Revenue and Profit Streams, Core Activities, and Geographical Sources of the Revenues
About Domino’s Pizza
Domino’s Pizza, founded on June 10, 1960, is based in Michigan, United States. The company deals with the delivery of desserts, chicken wings, pasta, and Pizza. It is the second-largest Pizza Delivery channel in the United States. The company trades on the New York Stock Exchange. Its subsidiaries such as Domino’s Pizza UK and Ireland trade on the London Stock Exchange (Thomson Reuters 2013).
The company has a presence in over 70 countries. Out of the 70, 50 are located within the stated in the United States. The company ranks second in the United States after the Pizza Hut. The heavy presence of the company in various countries can be attributed to franchising. The company owns about ten thousand stores across the world. Most of these stores are franchises. This paper will focus on analysing the Domino’s Pizza UK & Ireland Limited (Domino’s Pizza UK & Ireland Limited 2013a.)
Domino’s Pizza UK & Ireland Limited
It is a subsidiary of Domino’s Pizza Group Inc. The subsidiary has engaged about 24,000 employees and team members. The mission of the Subsidiary “is to be the best pizza delivery company in the UK, the Republic of Ireland, Germany and Switzerland” (Domino’s Pizza UK & Ireland Limited 2013a, p.1). The group has about 124 franchises. Each franchisee owns about 6.3 stores. The subsidiary operates in the United Kingdom, the Republic of Ireland, Luxembourg, Liechtenstein, Germany, and Switzerland. The table below summarises the number of stores in the various regions within the United Kingdom and Ireland (Domino’s Pizza UK & Ireland Limited 2013a).
Source of data – Domino’s Pizza UK & Ireland Limited 2013b, p. 21
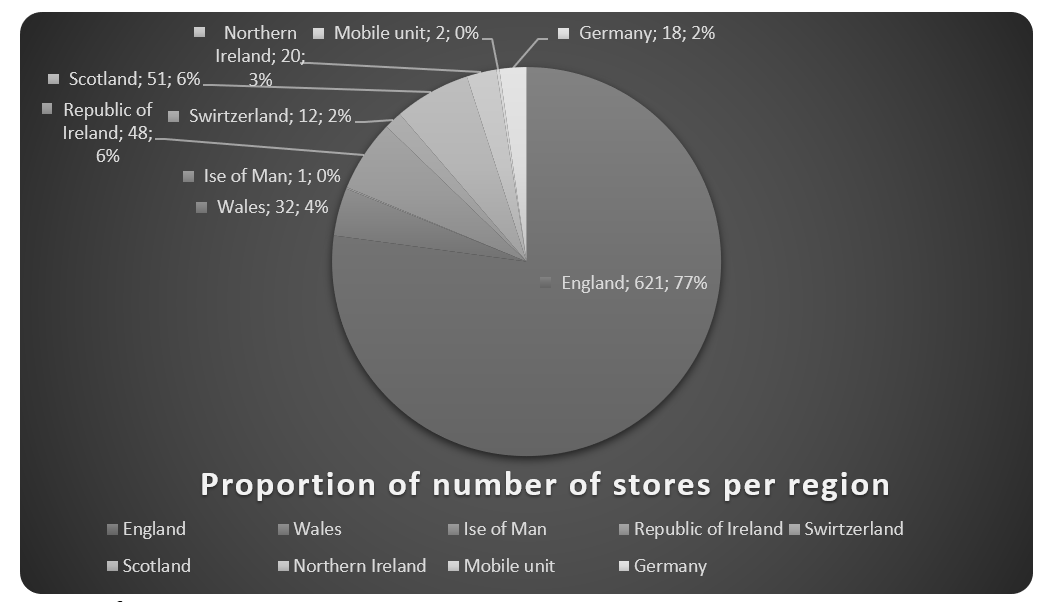
England regions have the highest number of stores followed by Scotland, the Republic of Ireland, and Wales. The Pie chart below illustrates the share of the number of stores in each region.

Source of Revenue
Domino’s Pizza UK & Ireland Limited generates revenue from three primary sources. The first source is from Royalties and sales of franchises. This mainly comprises of revenue from the “sale of pizza, sale of commissary food, equipment and delivery charges to franchises” (Domino’s Pizza UK & Ireland Limited 2013b, p. 19). It also includes commissions that arise from the sale of stores to customers.
The second category of revenue is rental income. The company earns rental income from the leasehold properties it holds. The third category is the finance lease income. It arises from “interest income from financing provided to franchises or finance leases” (Domino’s Pizza UK & Ireland Limited 2013b, p. 19). The table below summarises the key financial data for the company.
Income Statement Items
Source of data – Domino’s Pizza UK & Ireland Limited 2013b, p. 67.
The net profit margin of the company increased from £26,466,000 in 2011 to £30,307,000 in 2012. This is a 14.51% increase. It is consistent with the director’s statement “the Group profit for the period after taxation was £30,307,000 (2011: £26,466,000). This is after a taxation charge of £12,062,000 (2011: £12,323,000) representing an effective tax rate of 28.5% (2011: 31.8%)” (Domino’s Pizza UK & Ireland Limited 2013b, p.32). From the table, it is clear that all the items in the income statement of the company grew over the two years. The values are also consistent with the highlights provided by the Chief Finance Officer review p22.
Balance Sheet Items
Source of data – Domino’s Pizza UK & Ireland Limited 2013b, p. 68.
The balance sheet items also increased over the period. Total assets increased by 18.48%; total liabilities increased by 18.87% and shareholder’s equity increased by 17.87%.
Classification of Revenue
The table below summarises the source of revenue as per the three critical sources mentioned above.
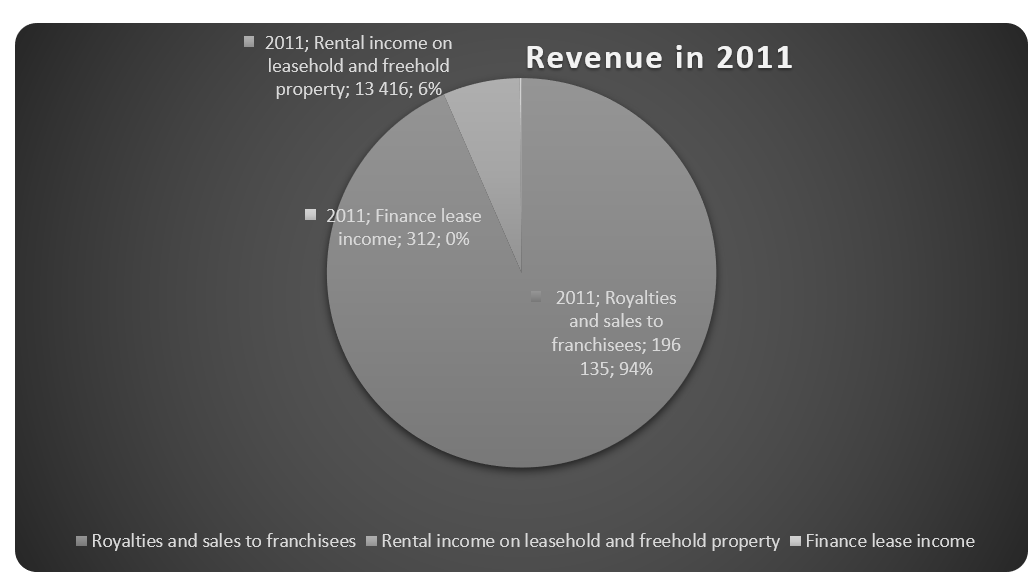
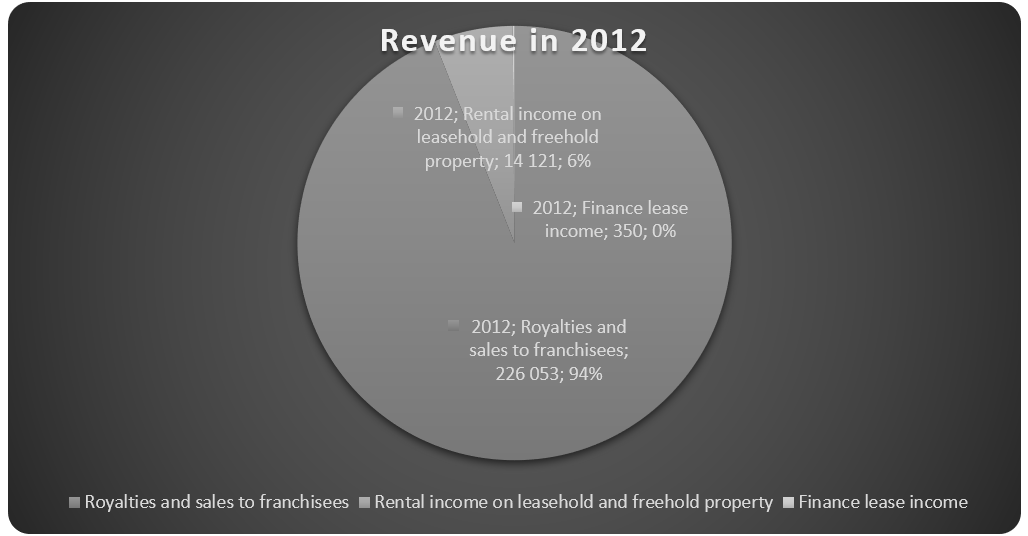
From the table above, it is evident that about 93% of total revenue is generated from the core activities of the business. These are royalties and sales of franchises. It is followed by revenue from rental income on leasehold and property at about 6%. Revenue from Finance lease income only contributes 0.15% of the total income. It is quite negligible. The pie charts below show the amount contributed by the various sources in 2011 and 2012.


Financial Analysis
The reported financial statements of the company do not give an in-depth analysis of the strengths and weaknesses of the company. Therefore, it is necessary to carry out an in-depth analysis of the financial statements to have a better view of the company. Further, an analysis of the company helps in making an informed decision.
Ratio analysis is a standard tool used to carry out financial analysis. It breaks down the financial data into various components for a better understanding of the financial strengths and weaknesses of the company (Collier 2009, p. 10; Brigham & Ehrhardth 2009, p. 273). Ratio analysis will focus on the profitability, liquidity and the gearing level of the company.
Profitability
Profitability ratios indicate the earning capacity of an entity. The ratios measure the effectiveness of a company in meeting the profit objectives both in the long run and short run. The ratios show how well a company employs its resources to generate returns. Commonly used profitability ratios comprise of gross profit margin, operating profit margin, net profit margin, the return on asset ratio, and the return on equity. The table below summarises the profitability ratios of the company for the past one year.
The profitability ratios for the company were relatively high. The gross profit margin was 36.59%. The operating profit margin was 17.74%, and the net profit margin amounted to 12.60%. Return on assets was 16.67% while the return on equity was 43.09%. The ratios measure the efficiency of management in using resources to generate sales and revenue.
Liquidity Ratios
Liquidity ratios show the ability of an organisation to maintain positive cash flow while satisfying immediate obligations, that is, the availability of cash to pay current debt. It is necessary to maintain optimal liquidity ratios since either low or very high ratios are not favourable (Holmes & Sugden 2008, p. 76). The table below summarises the liquidity ratios of the company for the past one year.
The current ratio of the company was 1.322. This implies that the current liabilities can be paid off using current assets. However, the quick ratios were quite low. This implies that the current liabilities cannot be paid off using quick assets.
Gearing Ratios
A company’s leverage is explained by the amount of debt financing it holds. The ratios are vital since they show the investor the extent of exposure to equity financing. A commonly used ratio is the debt-to-equity ratio. A high leverage ratio is not favourable since it scares away capital providers. It is because high ratios imply an increase in interest expense. This reduces the income attributable to shareholders. On the other hand, very low ratios are not favourable since it shows that the management of the company is not willing to exploit the potential of the company (McLaney & Atrill 2008, p. 26). The table below summarises the gearing ratios of the company for the past one year.
The debt-to-equity ratio shows that the amount of equity in the capital structure of the company is quite low. This implies that the company has room for taking more debt and expanding the size of the business. Further, the interest coverage ratio was quite high at 30.55 times. This implies that the earnings before interest and taxes can cover interest expense 30 times. This is quite favourable. It also gives the company room to take more debt. Management should be cautious of the amount of debt in the capital structure since too much debt can scare away potential investors. A lot of debt reduces the amount of net income attributed to shareholders. This, in turn, increases the cost of equity (Financial Times Limited 2013).
In summary, the results above show that the company is in a sound financial position, as indicated by the high profitability ratios and efficiency ratios. The management of the company needs to work on the liquidity ratios.
There are several ways of improving liquidity. The first is by increasing the current assets. The companies may reduce the average collection period. This is the time it takes for the company to receive payment from its debtors. Lesser collection periods are always preferred. This reduces the amount of time of changing debtors to cash. The companies may also increase their levels of cash and cash equivalents. The focus should not be on improving the stocks since there are associated costs that accrue when holding inventory.
Current Economic Conditions of a Country Where Domino’s Pizza Operates
Analysis of the United Kingdom
The section will analyse the economy of the United Kingdom market. From the reviews above, it is evident that over 70% of sales for the company is generated from the United Kingdom market. The table below summarises the total sales for the UK region.
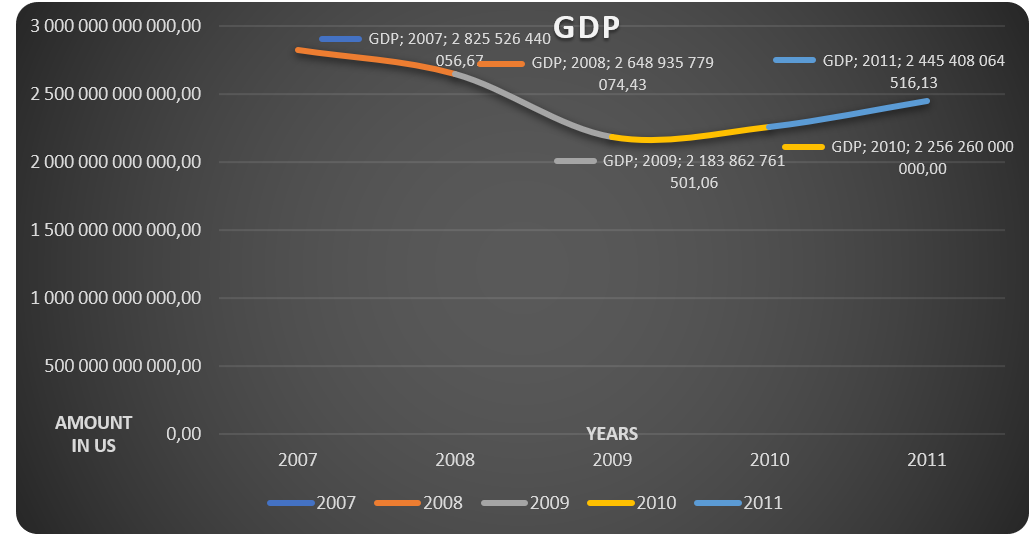
Since the United Kingdom region generates the highest amount of sales for the company, it is vital to analyse the market condition for the country. First, it is essential to look at the GDP of the country. The table below summarises the GDP of the UK for the past five years.
Source of data – Guardian News 2013
The GDP of the country has been on an upward trend since 2007. However, it declined in 2009 due to the economic recession. The recession in2009 affected the performance of the business.

The economy has not fully recovered from the various recessions that arose from a lot of debt that the economy could not support. This resulted in a slump in different institutions and businesses in the United Kingdom. Various analysts have reported a possibility of an economic recession in the coming years (BBC 2013a; BBC 2013b). This can be attributed to the inability of the economy to fully recover from the previous recession. Businesses anticipate reporting losses as a result of the recession. Management of the company needs to adequately plan for the recession so that the profitability of the company is not heavily impacted (Economic Watch 2013).
References
BBC 2013a, The UK economy to enter recession soon, says the report. Web.
BBC 2013b, UK economy grew more than thought in 2012. Web.
Brigham, EF & Ehrhardth, MC 2009, Financial management theory and practice, South-Western Cengage Learning, USA.
Collier, P. 2009, Accounting for managers, John Wiley & Sons Ltd, London.
Domino’s Pizza UK & Ireland Limited 2013a, About us. Web.
Domino’s Pizza UK & Ireland Limited 2013b, Annual Report and Accounts 2012. Web.
Economic Watch 2013, UK economic condition. Web.
Financial Times Limited 2013, Domino’s Pizza Group PLC. Web.
Guardian News 2013, UK GDP since 1955. Web.
Holmes, G & Sugden, A 2008, Interpreting company reports, Financial Times/Prentice Hall, Harlow.
McLaney, E & Atrill, P 2008, Financial accounting for decision makers, Prentice Hall Europe, Harlow.
Thomson Reuters 2013, Domino’s Pizza Group PLC. Web.