Introduction
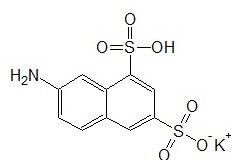
This paper is an introduction to the fluorescence and Ultraviolet/Visible Light (UV/Vis) analysis of the fluorescent label for carbohydrates 7-Amino-1,3-naphthalene sulfonic acid monopotassium salt monohydrate (KNDS). The experimental task is to analyze the absorption and emission spectra of the label dissolved in various solvents taken at varying concentrations. It is observable that the label is primarily a polycyclic aromatic hydrocarbon (PAH) naphthalene bonded to an amine group and a sulfonic acid group. Thus, it is also the objective of the experiment to ascertain whether the addition of these two groups to the PAH lowers or elevates the λmax (excitation wavelength) of the label.
Fluorescence Spectroscopy
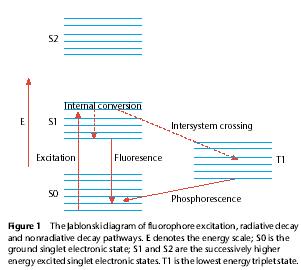
Fluorescence spectroscopy is widely used today in research involving the study of structural and dynamic properties of biomolecules. This analytical method involves emission spectra both at the simplistic steady-state level and the more complex time-resolved level. In polyatomic molecules like KNDS, which shows fluorescent properties and may be termed as a fluorophore, when exciting radiation is directed at the molecules the electrons in the ground electronic state (the singlet state) absorb the energy and transit to a vibrational level at an accessible excited electronic state. This destination excitation state must also be a single state (So and Dong, 2002). This process is amply demonstrated by Figure 2.

In such polyatomic molecules, electronic states are typically separated at energies of the order of 10,000cm-1. Each electronic state is further comprised of several vibrational sublevels separated at energies of 100cm-1 (So and Dong, 2002). Electronic transitions between states are possible only by photons with energies (capable of allowing the electrons to produce radiation of wavelengths less than λmax above which there can be no emission and no fluorescence) at the levels of ultraviolet to the blue-green regions of the spectrum (So and Dong, 2002). These transition energies are much higher than the thermodynamic one and so electrons in these molecules usually reside in the ground state unless excited by the required photonic energies (So and Dong, 2002), as is done by radiation at the required frequencies to elicit fluorescence during analysis of this sort. The excited electrons begin to emit radiation (fluorescence) to cool off and return to their native ground state.
Since the Pauli exclusion principle does not permit the electrons to be available at any one place at a time it requires that electronic wave functions be either symmetric or asymmetric spin states. The symmetric wave functions are triplet states with multiplicity of three while the antisymmetric states are singlet states with multiplicity of one (So and Dong, 2002).
The Stokes shift requires that the fluorescence wavelength is slightly greater than the one of the excitation radiation. The excited electrons remain in that lowest vibrational state in the excited state for a period of nanoseconds, the fluorescence lifetime, after which they are totally depleted of the excess energy and return to any allowable vibrational level in the electronic ground state.
The efficiency with which the fluorophore emits radiation can be quantified by the fluorescence quantum yield, Q: Q =T/K, where T is the fluorescence lifetime of the fluorophore and K is the intrinsic lifetime, where it is assumed that there is no non-radiative decay. (So and Dong, 2002).
UV Spectroscopy
In UV-Vis spectroscopy radiation with wavelengths 200nm to 800nm is usually used (Reusch, 2004). This is largely a part of the visible spectrum. The principle is the same as in fluoroscopy. When the radiation falls on the polyatomic molecules singlet electrons in the ground state absorb the radiation and transit to the next possible electronic excitation state to reside in a suitable vibrational level till they have depleted the absorbed energy in the form of radiation and can return to their native state. The spectrometer records the wavelengths at which the absorption takes place and to what degree. The spectrum is presented as a graph of absorbance (A) versus wavelength. Absorbance usually ranges from 0 (no absorbance) to 2 (99% absorbance) (Reusch, 2004).
The molar absorptivity is calculated because the spectrometer will read absorbance only in terms of the number of molecules in the instrument beam. It is defined as: molar absorptivity, ε=A/cl, where A = Absorbance, l = the length the light has to travel through the sample in cm and c is the solution concentration in moles/liter (Reusch, 2004).
Calculation of the molar absorptivity enables the comparison of the different absorbances of different polyatomic molecules. Polyatomic molecules capable of such absorbances are termed chromospores (Reusch, 2004).
The Chemical
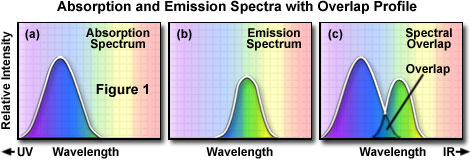
A description of the chemical is available from Table 1. Firstly, since the label can both fluoresce and absorb it is termed a fluorochrome (Davidson and Abramowitz, 2007). For the label, the manufacturer has given a peak excitation figure of 310 nm at smaller wavelengths and a peak emission figure of 450 nm at larger wavelengths. When the absorption (excitation wavelength) curve is plotted with relative fluorescence as the vertical axis and absorption wavelengths in nm as the horizontal axis it will be observed that this curve (Fig. 1a) is mirrored by the emission curve. The emission curve is plotted with relative fluorescence as the vertical axis and emission wavelengths as the horizontal axis (Fig. 1b). It is observable that the absorption curve is mirrored by the emission curve though at larger wavelengths due to the principle of Stoke’s Law which states that excitation is at smaller wavelengths through emission is at slightly larger ones. Figure 1c, Appendix, shows that there is a slight overlap between the absorption and emission curves. The higher wavelength end of the absorption curve overlaps with the smaller wavelength end of the emission one. This overlap can be eliminated by using suitable filters that ensure that excitation does not occur at the overlapped wavelengths while emission does not occur in those wavelengths either (Davidson and Abramowitz, 2007).
Table 1. Description of Chemical.

It is also notable that the label is a conjugated polyatomic molecule with two conjugates 0 an amino group and a sulfonic acid group. Conjugation enables the fluorochrome to be both fluorescents at lower energies as well as ionized during processes like electrophoresis. The conjugation of the main naphthalene molecule reduces its excitation and emission energies and enables easier instrumentation as few instruments are capable of measuring radiation with wavelengths below 200nm (Davidson and Abramowitz, 2007).
It is also notable that the fluorochrome is now capable of being dissolved in polar solvents like water as the values of its intermolecular forces are lowered with conjugation. Naphthalene, which is a polycyclic aromatic hydrocarbon, with a notoriously stable structure, has few singlet electronic excitation states to offer at lower energies. Conjugation makes these available. Also, when the label is dissolved in solvents with strong intermolecular forces that further weaken the polyatomic bonds within it even less energy is required to produce fluorescence as the weakened in the dissolved label makes available singlet electronic excitation states at even lower energies than the undissolved label.
The result is that λmax increases in solvents with decreasing concentration and, the fluorescence lifetime, decreases accordingly and vice versa. The paper does not introduce the finesse of instrumentation of the analytical process but it does include the theoretical intricacies of the fluorescent and UV-Vis spectroscopy processes rather comprehensively.
References
Davidson, Michael W., and Abramowitz, Mortimer, Fluorescence Microscopy, 2007. Web.
Reusch, William, Ultraviolet-Visible Spectroscopy, 2004. Web.
Royer, Catherine A., Approaches to Teaching Fluorescence Spectroscopy, Biophysical Journal, Vol. 68, 1995, pp. 1191-1195.
So, Peter T.C., and Dong, Chen Y., Fluorescence Spectrophotometry, Encyclopaedia of Life Sciences, 2002, Macmillan Publishers, Nature Publishing Group.
