Abstract
The goal of this experiment was to illustrate various parameters of radioactivity, including the plateau of a Geiger-Muller counter, finding the resolving time of a Geiger tube, verifying the inverse square law, measuring the penetrating power of alpha, beta, and gamma radiations, as well as evaluating the count statistics of radioactive substances. The optimal voltage for the Geiger-Muller counter was 900 volts, whereas the percent per change in 100 volts was 4.167. The threshold of the voltage plateau was 720 volts while the dead time was 3.42 ms. The radiations obeyed the inverse square law and their penetrating power was indirectly proportional to absorber thickness (x1/2= 3 mg/cm2 and µ=0.231). The Gaussian distribution of Cs-137 explained the standard deviation better than the Poisson one but was not accurate in explaining the Cs-137 counts.
Introduction
Naturally occurring atoms are unstable because they contain excess energy within their nuclei. To gain stability, these atoms decay by releasing the extra energy in the form of radiations. Living organisms absorb small quantities of these radiations, which also have industrial and medical applications. The three main types of radiations are alpha (α), beta (β), and gamma (γ), which vary in strength, intensity and penetrating power (Eichholz 2018). Radioactive radiations can be detected and quantified using a piece of equipment known as a Geiger-Muller counter. The purpose of this experiment was to characterize the radioactive emissions of different chemical elements using a Geiger-Muller counter.
Experimental Process
The first experiment entailed determining the plateau of a Geiger-Muller counter. The radioactive isotope was placed in the Geiger-Muller tube followed by varying the voltage across the tube and measuring the counting rate. The ST-360 was switched on followed by double-clicking the STX software to start the program. Cs-137 was put as a button source in the middle shelf. A starting voltage of 700 volts was selected alongside a step-up voltage of 20 volts for 30 seconds and 150 runs. The ensuing data were saved and subjected to data analysis using Microsoft Excel.
The second part of the experiment involved determining the resolving time. The Geiger counter was set up as described previously and set at the optimal operating voltage of 900 volts. The number of runs was set at 0, whereas the time was put at 60 seconds. An initial run was done devoid of a radioactive source to determine the background radiation. Two half samples were placed separately in the upper shelf at each run to measure the number of counts, which were recorded as r1 and r2. The value of r3 was found by measuring the counts of the two half samples simultaneously.
The third part of the experiment aimed at ascertaining the inverse square law. The Geiger counter was set at 900 volts, 0 runs, and preset time of 30 seconds. Sr-90, which was used as the radioactive source, was placed on the top shelf (2 cm from the detector components of the Geiger counter) after first determining the background radiation. The counter readings were taken when the radioactive source was placed on ten different shelves.
The fourth part of the practical involved determining the penetrating power of ionizing radiations. The Geiger counter was set at 90 volts, 0 runs, and a preset time of 60 seconds. After determining the background radiation, the radioactive material (Cs 137) was placed on the second shelf from the top. An absorber piece was put on the top shelf before data collection. The process was repeated 5 more times using absorbers of increasing thickness. The entire process was repeated using one source of alpha and beta radiations.
The last part entailed evaluating the count statistics of radioactive substances. The Geiger counter was set up as explained previously. The parameters used included a preset time of 5 seconds and 150 runs. Background radiation was measured for 12.5 minutes. Thereafter, the time was reset to 1 while the runs were put at 750 before measuring the radiation of cesium-137 source.
Results
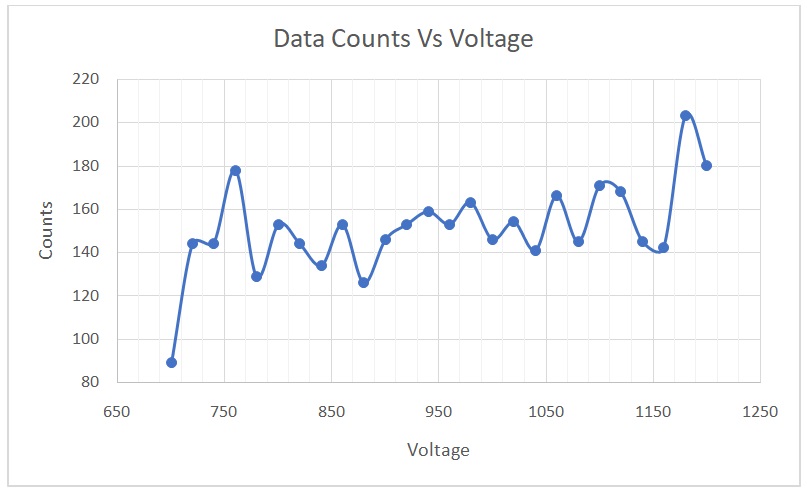
A plot of counts versus voltage is shown in Figure 1. The percent per change in 100 volts was calculated using the equation shown below.

[(168-144)/144]/[(1120-720)/100] ×100
(24/144)/(400/100)×100
(0.1666/4)×100
4.167 percent per change in 100 volts.
The best operating voltage for the tube was 900 volts. The threshold of the voltage plateau was 720 volts, whereas the operating point was between 720 and 1120 volts. The continuous discharge point, conversely, was 1180 volts. In the second section of the experiment, the value of T was calculated using the equation
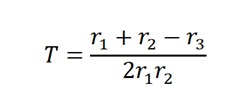
T= (142+149-146)/2×142×149
T= 145/42,316
T=0.00342 S, which is equal to 3.42 ms.
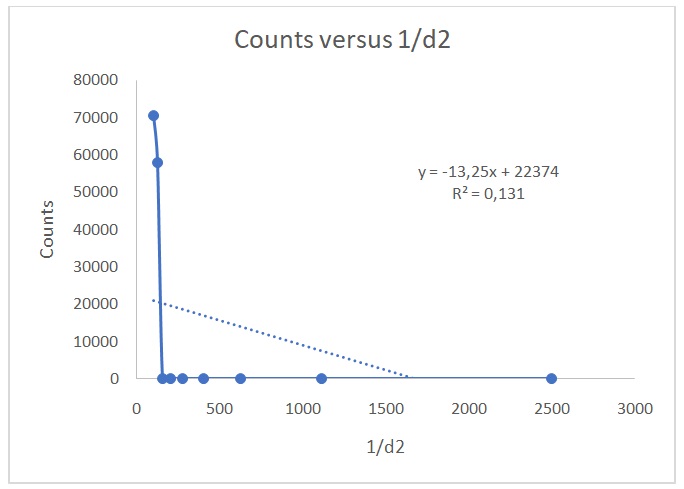
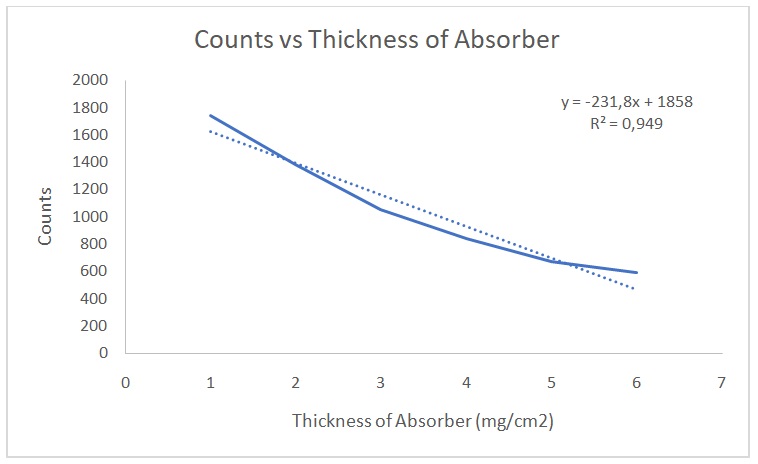
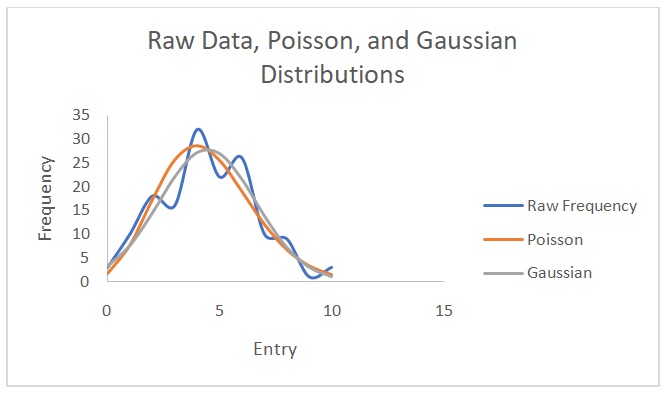
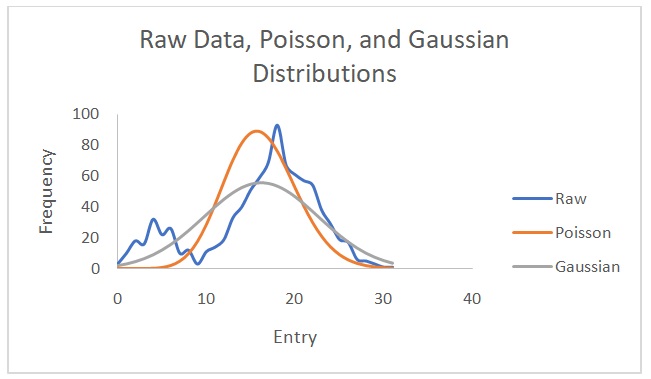
Figure 2 shows a plot of counts versus 1/d2. Figure 3 indicates that the counts are indirectly proportional to the absorber thickness. From the best line of fit, x1/2 is 3 mg/cm2 and µ is 0.231. On the other hand, Figures 4 and 5 show the raw data, Poisson, and Gaussian distributions for the background counts and Cs-137.
Discussion
The best operating voltage for the tube was 900 volts, whereas the percent per change in 100 volts was 4.167. Given that this value was less than 10, it meant that the counter was in optimal working condition. This voltage would not be identical for all the different tubes in the lab because the efficiency of each tube is determined by its lifespan and care. Additionally, this figure is expected to be different 10 years from now because of wear and tear due to the continued use of the tubes. As the tubes wear out, the operating voltage increases, meaning that higher voltages would be needed (Bergeson, Peatross & Ware 2017).
The resolving time for the GM tube was 3.32 ms, which fell within the accepted 1 to 100 ms range. The percentage of correction was the same for all values because the same correction factor was used to account for the counter’s resolving or dead time. The inverse square law states that the strength of radioactive radiations reduces by factor 1/d2 if a radioactive source is placed at a distance d away from a Geiger counter (Eichholz 2018). Figure 2 shows that the data conform to the inverse square law. However, the data do not follow Excel’s best line of fit because of the low value of R2 (0.1314). Values of R2 that are close to 1 indicate that the data correspond to Excel’s best fit line. This observation verifies the inverse square law because the expected graph in a typical relationship that adheres to the law is a hyperbola (Was 2016), which was obtained in Figure 2. When the GM tube is placed near the source, all the counts recorded are not necessarily due to the source but a sum of the source and background counts when no radioactive material is in the Geiger counter. The true number of counts due to each radiation source is calculated by subtracting the background noise from the recorded counts.
The data on counts versus thickness were linear. Additionally, the value of x1/2 was a correct approximation. We cannot be completely shielded from radiations because small quantities will still penetrate absorbers. However, shielding reduces the quantity of radiations that individuals are exposed to (NRC 2017). The absorption of gamma, alpha and beta particles are different because each particle has a different range and penetrating power. The best shielding material for combined beta and gamma source as well as combined gamma and alpha source would be F.
The distribution that matches the data with the background counts is the Poisson distribution. The Gaussian distribution does not describe the Cs-137 data well because of varying amplitudes in the raw data and predicted data. This distribution predicts lower Cs-137 data than the observed values. Theoretically, it is not possible to find a value for the Poisson distribution with data from Cs-137 source because of its long half-life of 30.17 years (EPA 2019). However, in this experiment, the values were erroneously obtained possibly due to experimental errors. The standard deviation values are closer to each other when calculated with the Poisson distribution than when computed using the Gaussian distribution. Nonetheless, the normal (Gaussian) distribution is more correct because it demonstrates how individual entries differ from the mean in a real-life scenario. Overall, it is easier to calculate a Poisson distribution than a Gaussian one.
Conclusion
Radioactive decay leads to the production of particles that can be sensed using a Geiger-Muller counter. However, background radiations should be considered in calculations involving radioactivity. Overall, gamma radiations have higher penetrating power than alpha and beta particles, which underscores the need for protection when handling radioactive material.
Reference List
Bergeson, SD, Peatross, J & Ware, MJ 2017, ‘Precision long-term measurements of beta-decay-rate ratios in a controlled environment’, Physics Letters B, vol. 767, pp. 171-176.
Eichholz, GG 2018, Principles of nuclear radiation detection, CRC Press, Boca Raton, FL.
EPA 2019, Radionuclide basics: cesium-137. Web.
NRC 2017, Minimize your exposure. Web.
Was, GS 2016, Fundamentals of radiation materials science: metals and alloys, Springer, New York, NY.