Introduction
The purpose of this laboratory work was to determine the focal length for two convex lenses using the Lens Equation method. For this purpose, the lens was placed in a holder on a horizontal surface, and a lamp and a screen were placed on either side of the lens. By moving the components, the optimum distance was determined, leading to the clearest possible image of the object on the screen. The focal lengths for both lenses were determined by searching for the mean value, as well as graphically, and the results were compared.
Data
As part of this laboratory work, several experimental parts were carried out from different angles to evaluate the optical effects of light rays passing through lenses. For two convex lenses, A and B, the distances from lens to object (S0) and from lens to screen (Si) were measured using Lens Equation. The data is entered in the first rows for each lens in Table 1: the distances shown below were determined as the optimum distance for getting the clearest possible image on the screen, i.e., the object could be said to be in focus.
Table 1. Distances S0 and Si for two convex lenses in an experiment using the Lens Equation method
Results
Focal length is defined as the numerical characteristic that determines the difference between the position point of the lens and the point at which light rays converge for a convex lens (Davis, 2022). In this paper, two convex lenses were used for which two corresponding distances have already been measured, the values of which can be used to calculate the focal lengths. Table 2 contains information about these calculations, and an example of the calculations is shown below the table. For all four trials, the average focal lengths were also determined for each of the two lenses, which were 9.883 meters for lens A and 19.114 meters for lens B.
Table 2. Calculated focal length values for all eight tests for two convex lenses
Analysis
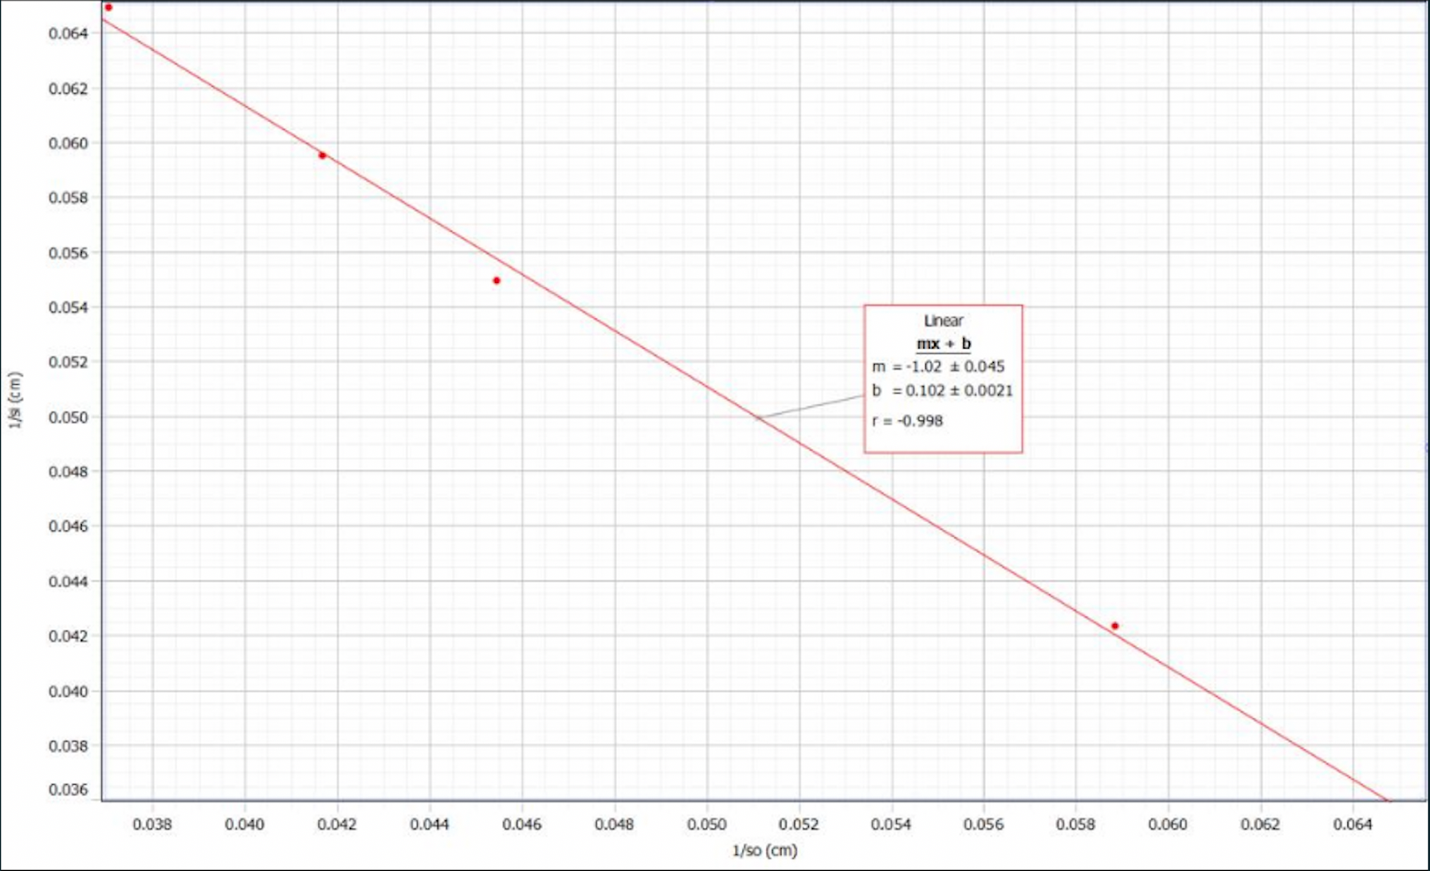
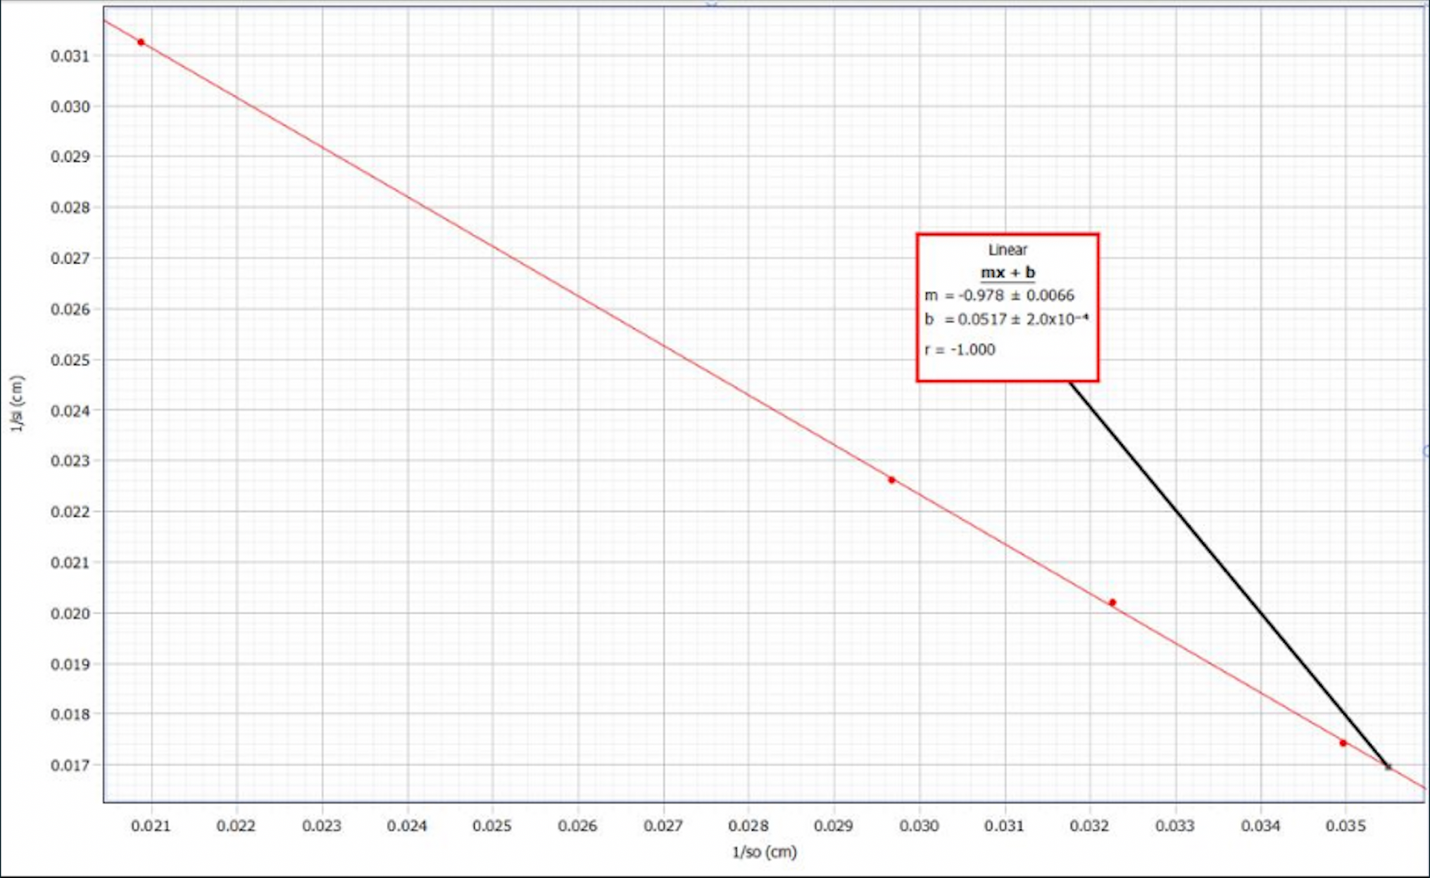
For the dependence of the inverse values of the distances from the lens to the image and from the object to the screen, scatter plots with regression straight lines were also plotted. Figure 1 shows the dependence of these quantities on each other for lens A. It can be seen that this relationship has a downward trend. That is, as the distance from the lens to the object increases, the distance from the lens to the screen tends to decrease. Most interesting for this graph, however, is the interpretation of the y-intercept coefficient, which is 0.102±0.002 m-1. The theory indicates that the inverse y-intercept value should coincide with the average inverse focal length for the lens under ideal conditions. In this case, the focal length determined graphically is 9.804, which creates a percentage error with the previously determined average of 0.8%. For convex lens B, whose scatter plot is shown in Figure 2, the graphical focal length is 19.342, which creates a 1.2% error with the mean. It follows that both options for calculating the focal length are effective, and the error between them is minimal.


Conclusion
From the data obtained, it can be concluded that both options for determining the focal length appear to be acceptable since the percentage error between them was minimal. However, it is not unlikely that increasing the distance from the object to the lens would increase the error, as was shown for lens B. To reduce this error, it is recommended that instruments be checked before use, that all data be carefully recorded, and that uncertainties in measurement, which can affect the accuracy of the results, be taken into account. Overall, this experiment can be considered a success because it accomplished the goal.
Reference
Davis, U. C. (2022). Lenses and ray tracing. LibreTexts. Web.