Charts
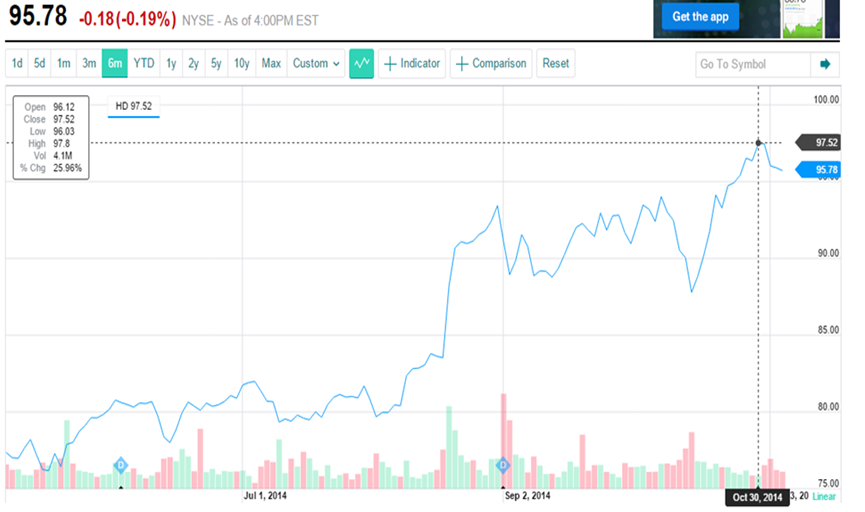
The graph presented below shows the 6-month chart for the stock prices.

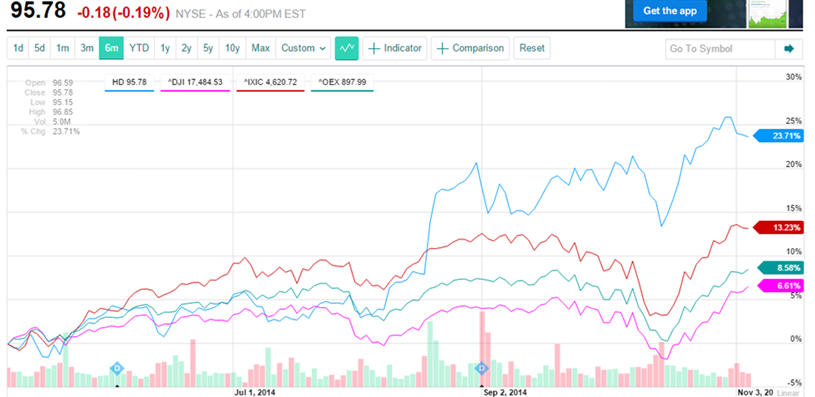
The graph presented below shows a comparison of the 6-month chart for the Home Depot Company, NASDAQ, S&P 500, and Dow Jones Industrial Average.

Discussion
In the graph above, it can be noted that there was a general rise in the value of the stock for Home Depot and the market as represented by the trend for NASDAQ, S&P 500, and Dow Jones Industrial Average. It can be observed that the trend for the three market indices moved in the same direction throughout the six months. The trend for Home depot was similar to the market trend until August. However, from August, the stock price for Home Deport rose faster than the market indices.
Profitability
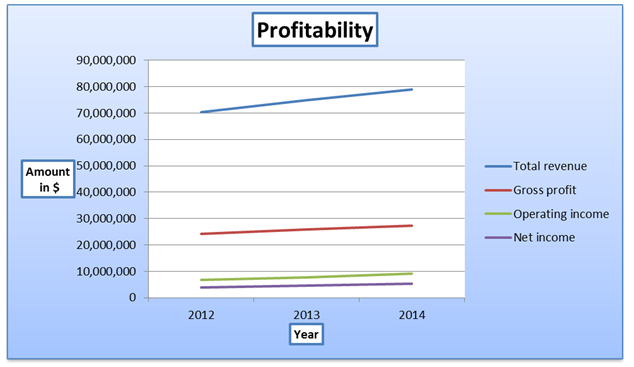
The table presented below shows a summary of the total revenue, gross profit, operating income, and net income.
Based on the table above, it can be observed that there was a general increase in the value of the total revenue and income. Total revenue increased by 11.96% during the three years. The gross profit rose by 12.89%. The operating income and net income increased by 37.61% and 38.68% respectively. The rise in the values shows that there was an improvement in profitability. This also indicates the growing inefficiency of management in managing sales and pricing. The trailing profit margin (ttm) for the company for the year ended 2nd February 2014 was 7.18%, while the trailing operating margin (ttm) was 12.12%. The values are quite high and it is an indication of high profitability.

Analyst Opinion
The mean recommended by the analysts this week is 2.0 while for last week was 2.0. This implies that an investor should buy the stock because they anticipate earning a positive return. Further, the upgrade and downgrade history show that the company had 5 upgrades and 3 downgrades. It shows that the company performs well financially.
Analyst estimates
The analysts estimate that revenue for the year 2014 will be $82.65billion. They expected the revenue to grow to $86.30billion in 2015. Further, the expected earnings per share for 2014 is $4.50 while in 2015, the analysts expected the earnings per share to increase to $5.21. Finally, this year, the company is expected to grow by 19.70% and by 15.80% next year. The industry in which the company operates is expected to grow by 9.90% this year and 21.60% next year, while the sector is expected to grow by 7.80% this year and 17.60% next year. Finally, the performance of the S&P 500 index is expected to grow by 7.90% this year and 10.90% in 2015. Thus, analysts expected that the growth of the company in 2014 will surpass that of the industry, sector, and S&P 500 index. Generally, analysts anticipate that the company will report growth in performance in 2014 and 2015.
Summary
On 5th November 2014, the closing price for the stock of Home Depot was $95.78. The price was 0.18 points down. This is equivalent to a 0.19% decrease. The 6-month chart presented above shows that there was a general rise in the price of the stock as indicated by the upward trend. Further, it can be pointed out that there was less volatility because the range of price movement as a percentage of the average of high and low prices was dismal.
Reference
Yahoo Finance. (2014). The home depot, inc. (HD). Web.