- Evaluation of the Economic Environment for FDI in the UAE
- Assessment of The Growth and Direction of FDI in the UAE
- Theoretical Implication and Government Policy towards FDI
- Why Developing and Developed Countries Increased FDI to UAE
- Annual Revenue Increase Comparison for the UAE Economy
- The Investment of Coca-Cola Company in UAE
- Benefits And Problems Faced By Coca-Cola Company In UAE
- Works Cited
Evaluation of the Economic Environment for FDI in the UAE
World Economic Forum (4) pointed out that the UAE has been experiencing a steady growth of GDP an average of 10 % during 2010 and the country has fixed up its target to achieve 8% per annum growth rate up to 2015 while the country has anticipated towards 3.5 % population growth and per capita income reaching at US$ 50,000.
Assessment of The Growth and Direction of FDI in the UAE
Library of Congress (16) mentioned that due to the governmental policy of law liberalization, the intensity of foreign investment in the UAE has been growing in an accelerating rate, as per existing policy for any foreign entry in UAE, necessarily needed to have 51% shares while the dominating power conserved to the national companies OECD (21). It has been evidenced that traditionally the country emphasized keeping control over the foreign companies, although the local system encouraged the foreign companies with favorable investment environment by providing, energy and infrastructural support.
At the same time, the government also established free trade zones in some areas like Dubai where the foreign companies are entitled to own 95% of the owner including controlling power and thus the free trade zones have turned as an effective attraction for foreign investment in UAE. Moreover, the foreign companies in UAE are also enjoying corporate tax holidays along with the immunity of personal taxes for the foreign entrepreneurs, while there are also opportunities duty-free importations.
Global Office (1) argued that there are both forms of foreign direct investment (FDI) inflow and outflow in UAE but the attracting foreign trade zone has shaped another more influential driver for the multinationals while the total volume of FDI in the free zone of UAE has reached at the US $ 73 billion. Within the last three decades, the export processing areas in the free trade zone has turned as a heavenly place of investment where local legislation doesn’t encounter the multinationals to their restriction-free business operation and the country has turned as the second FDI attractive region in the world. The Minister of Foreign Trade already announced that the multinational would be entitled to obtain 100 % ownership in the country setting their business in thee 36 free zones of UAE serving investors, targeted gain US$ 200 gross export revenue per year by creating about 40 million direct employment opportunity.
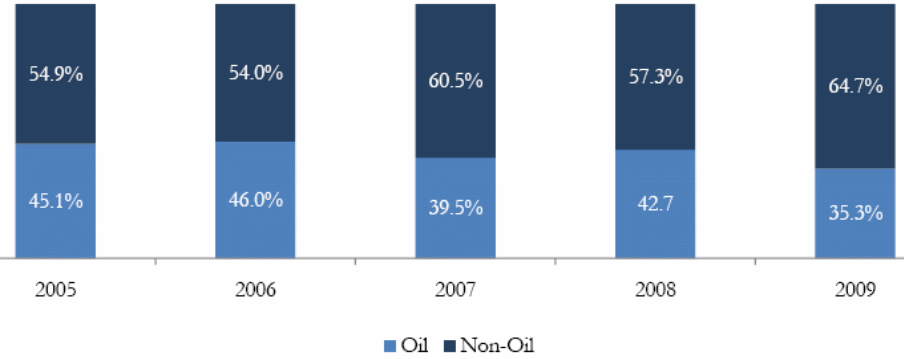
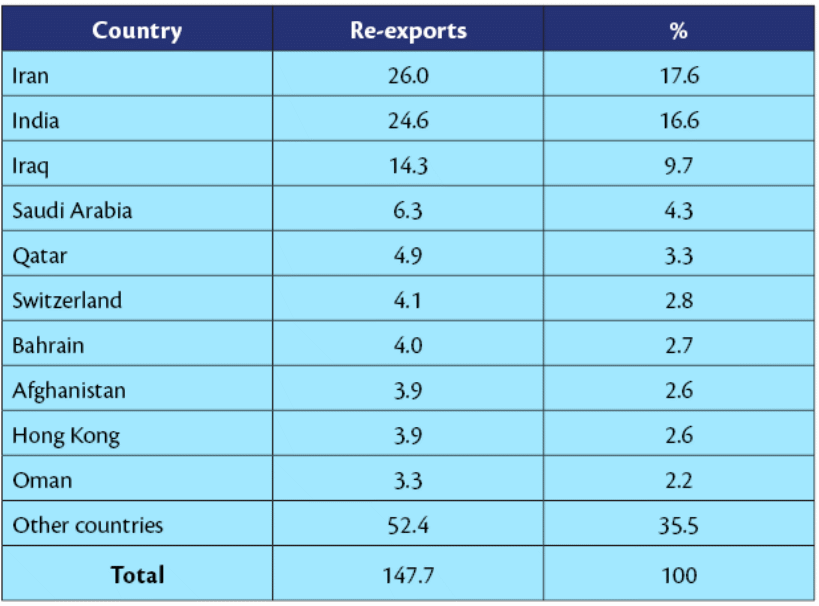
National Bureau of Statistics (18) presented that the net exports of UAE are directly associated with the savings, investment, and trade balance between the internal and economy represented by the multinational and local firms’ direct operation in the global market. In 2009 trade balance by the country in its export (which was 125.9 bn according to GCC (1)) and import were US $ 16.1 billion, though the global financial crisis has shocked the housing sector and job cut while there was a decrease of inflation 1.56% in 2009, which was 12.3% in 2008. The export data for 2005 to 2009 has presented in the following diagram—
Theoretical Implication and Government Policy towards FDI
Alfaro (2) pointed out that the modern literature of foreign direct investment has aligned the policymakers and academics to emphasis of the FDI inflow to ensure GDP growth of a developing country by supplying capital for further development and a major resource for heavy technological implication. FDI also furnish the opportunity to the local companies to be integrated with the multinational through backward linkage industry even though the theoretical framework of FDI advocates to the rewards and advantages, spillover possibly will even so be smaller, for instance, the macro pragmatic actions have investigated with the effects of comprehensive FDI inflows and generated different debates.

Bevan and Estrin (2) argued that the particular merits of FDI has generated different types of incentives for the multinationals to get an entry in the developing countries but to put into practice, a raising number of modern researchers from this area have started to be rise question is FDI inflow by the multinational can progress the economy. Economists from this region raised some basic questions while the multinationals are increasingly violating local legislation, exploiting the workers in host counties, and abusing the natural resources, – does the GDP growth is the only indicator of national growth?
Such a question would also point to the raising conflicts and with the national capital opposing the foreign, as the weight of capital in developing countries is very weak and was unable to encounter with FDI, they have to pact with the multinationals to exploit local workers and people. The governments of the host countries are eager to get FDI in an enhancing rate, and to do so they provide the highest consideration to the multinational and even they amend and introduce new legislation to make the multinational happy. The progressive researchers of the modern era are not willing to provide open opportunities for globalization, which ultimately drive to Americanization, and urged to encounter the IMF and World Bank presented data with the real scenario of the affected counties.
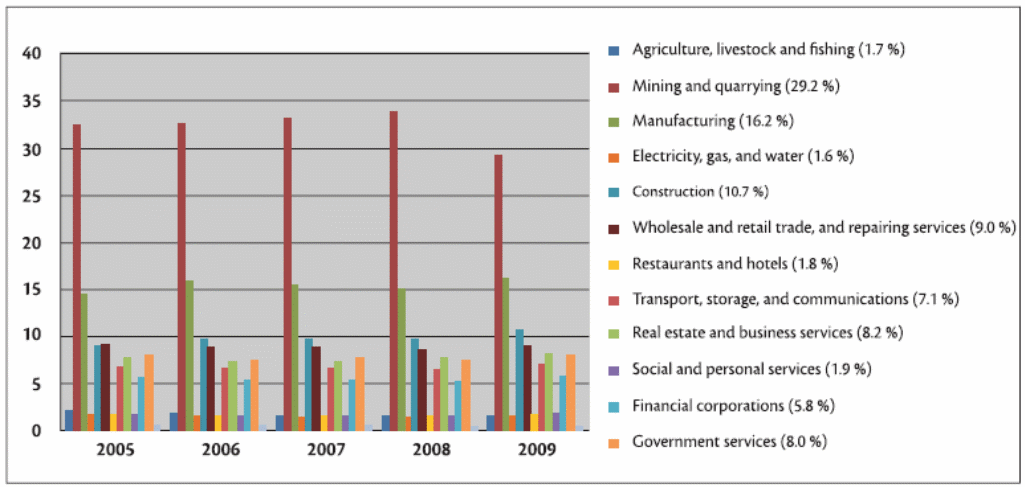
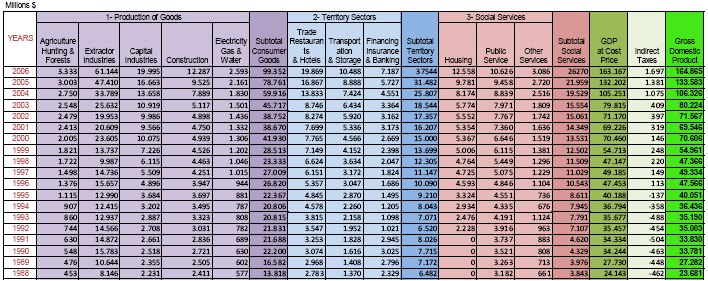
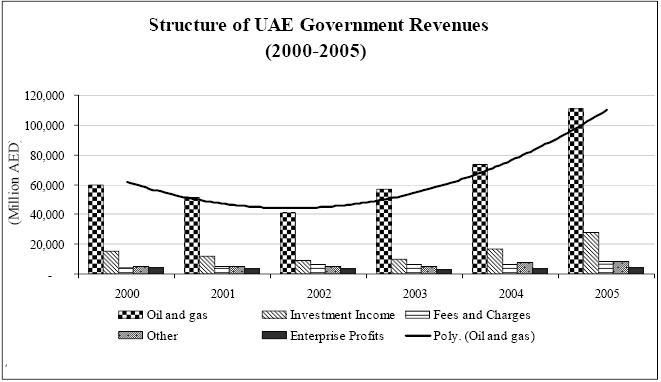
Also, how successful government policy towards FDI can help them to attain more revenues has also proved by the UAE government; the gradual increase in is highly notable:
Why Developing and Developed Countries Increased FDI to UAE
The main reason why the developing and developed countries have increased their FDI to UAE lies behind the fact that the government of the country is presently showing quite a friendly attitude towards the foreign business environment (ADB, 16). As a part of the WTO, the country has commitments to lower trade barriers, tariff, customs duties, and taxation on the companies who directly operates in the country (WTO, 1).
Such a business and investment-friendly environment means that more and more developed and developing countries are showing their interests to invest directly in such an attractive market, as UAE is gaining gradually strength (IMF, 1). Apart from the investment-friendly environment, “market attractiveness” is another important factor in why these foreign countries are increasing investments.
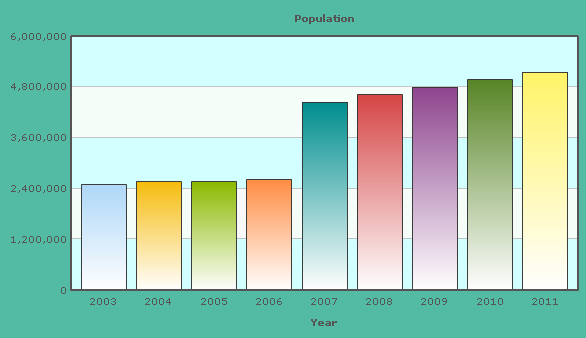
The market attractiveness depends upon the UAE’s population structures and income patters. It is important to argue that the more the population, the greater will be the market for the foreign MNCs. Even though UAE has a large population, but the concern for the MNCs is that it has a very slow growth rate as compared to China or India. Slower population growth rate would mean an aging population, and consequently, a comparatively low population as a whole. The following table shows the population structure of the country:
Table 2: The population growth rate of the UAE. Source: Generated from Index Mundi (1) and AMF (1).
The graphical presentation of the above information has shown in the figure below:
On the other hand, although the country has a falling population growth rate, but, conversely, the fact that the average income of the country of per head people are greatly high means a relief for MNCs, as the more the income of people, the more is their purchasing powers. Moreover, although the growth rate of the country has slowed down in 2009 (according to The World Bank Group (1) it fell to $230,251,878,599), but it is increasing gradually from last year. The following table shows the income patterns per head, buying power uniformity, GDP composition by sector, and the real growth rate of the UAE:
Table 3: The income patterns, buying power, GDP composition by sector, and the real growth rate of the UAE. Source: Self-generated from Index Mundi (1) and PWT (1).
Another benefit of developed and developing countries to invest in UAE is that it is free trade zones, where, they are gaining benefits from freedom from all sorts of duties (according to Index Mundi (1), it offers a hundred percent foreign ownership and zero taxes).
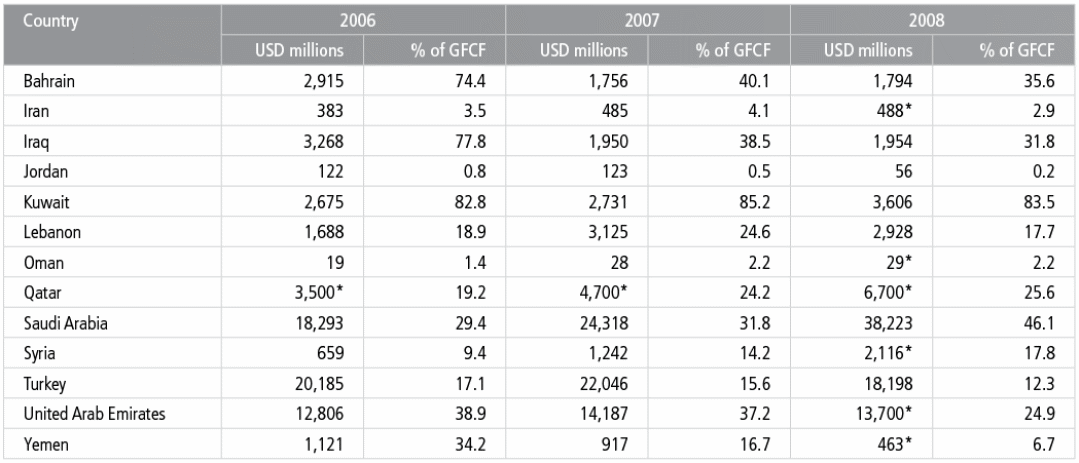
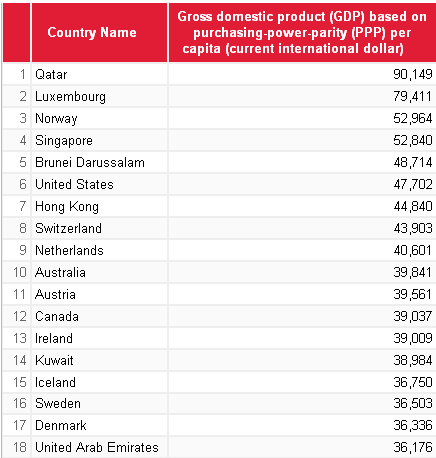
On the other hand, in ensuring that a rising number of foreign countries and their MNCs should invest in UAE, the government, for years, has concentrated in the fixed capital formations and modernization programs (UNCTAD, 1). The table below shows the comparison of how successful UAE has been in fixed capital formations than others:
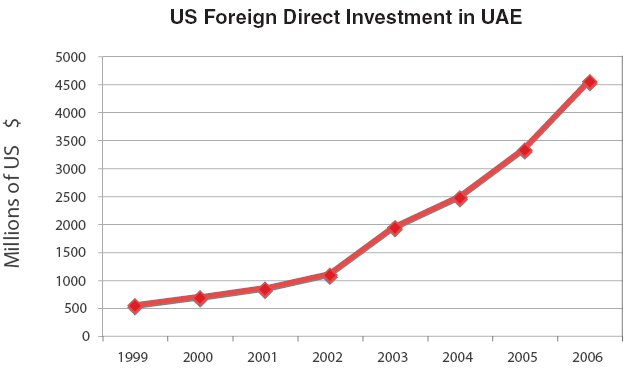
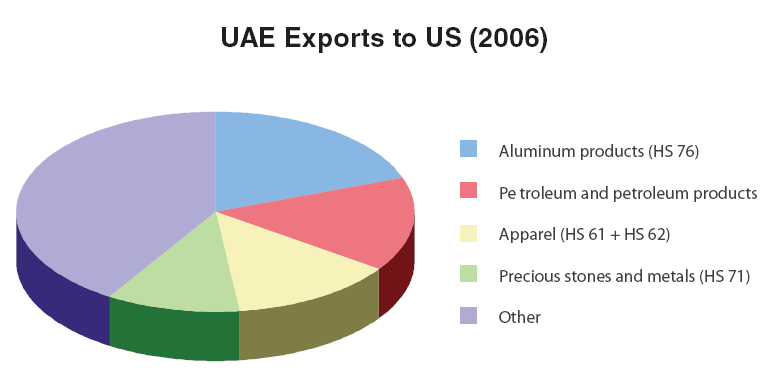
Moore (2) argued that USA’s FDI in UAE has raised 445% from about USD 834m in 2001 to USD 4547m in 2006; moreover, UAE’s share in US exports to the GCC raised from 25% in 2001 to 49% in 2006 – indicating the influence of free trade zone and the WTO; this has also boosted UAE’s growth. The following table shows this improvement of US FDI in UAE:
The pie chart below shows how rising UAE exports in the US helped it to achieve growth:
Annual Revenue Increase Comparison for the UAE Economy
The following figure shows the annual revenue increase comparison of the UAE economy with some other economies:
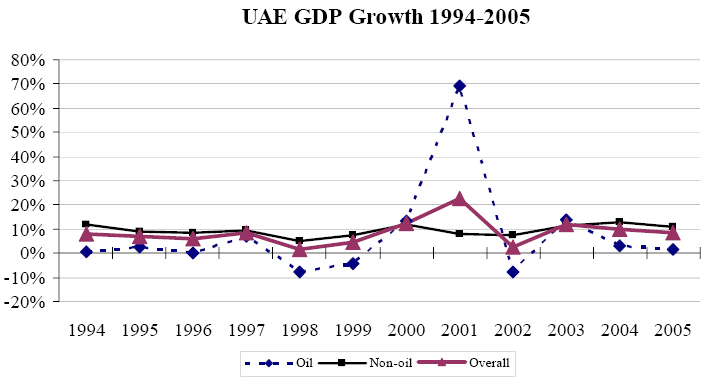
UAE is one of the world’s main oil-producers; so, substantial segments of UAE’s GDP comes from oil; additionally, over last 10 years UAE has more than doubled its GDP, totaling AED 358 bn in 2005; however, oil’s contribution to GDP has lowered at this time, and non-oil GDP was the key driver with a share of 73% in 2005:
The Investment of Coca-Cola Company in UAE
The factors discussed in the earlier sections of this paper indicate the reasons why foreign MNCs like Coca-Cola are increasingly showing their interests in investing in the UAE market. A large population, coupled with extremely high purchasing power parity, WTO membership, UN membership from 1971 (UN, 1), more government expenditure in fixed capital formation, friendly attitude towards FDI, and free trade zone means that the attractiveness of the UAE market is by no means lesser than Indian market to Coca-Cola Company. Therefore, the investment plans of the company in the UAE have expected to rise further. The benefits that Coca-Cola gains from UAE, together with the potential problems, as outlined below.
Benefits And Problems Faced By Coca-Cola Company In UAE
The Benefits to Coca-Cola Company
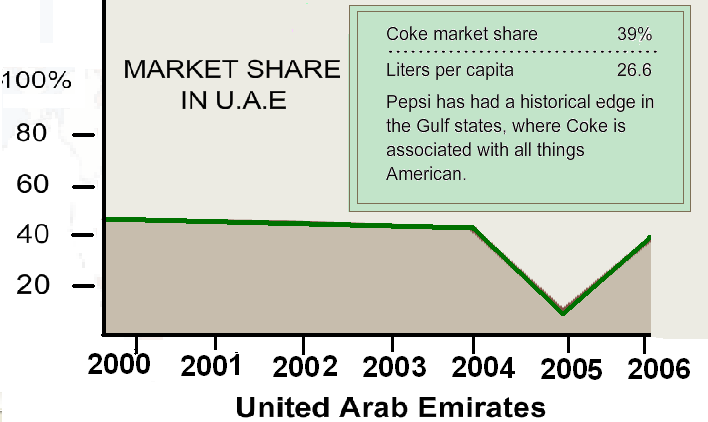
The market share of the company in the Middle East, and most importantly in the UAE is rising gradually. A higher market share means that the business will be able to get higher profits than that of the competitors. Presently, Coca-Cola’s market share of the UAE is 39%, as shown below:
The chart below shows the comparison of Coca-Cola’s Middle East’s market share with its share on other segments of the world:
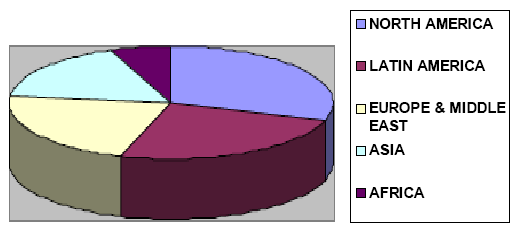
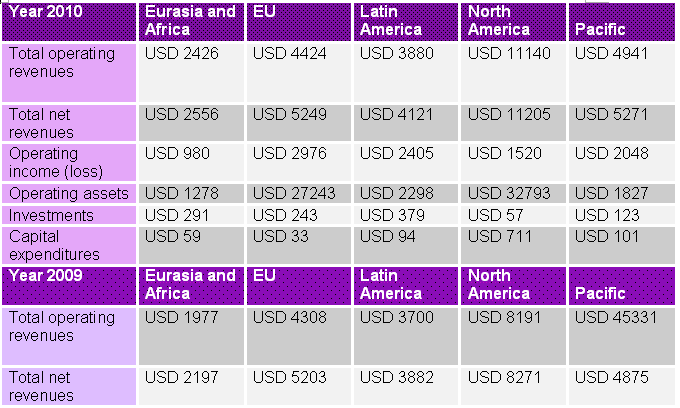
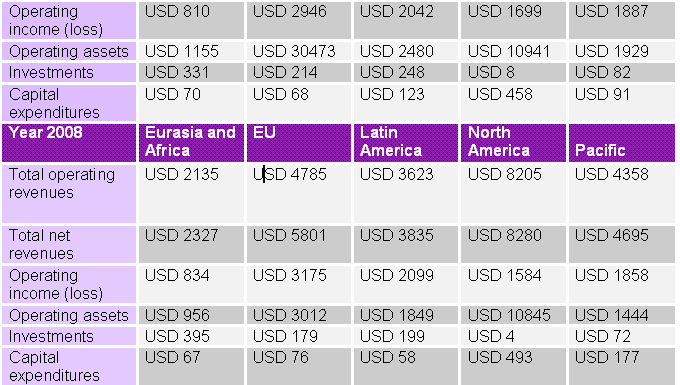
It is important to argue that such a rising market share of the company in the UAE is generally causing an augmentation in its revenues (Ligaya, 1). Rising revenues are apparent in the data provided below, which shows how the growing sales and profits from the UAE is, in turn, causing a rise in revenues of Coca-Cola from its Eurasia’s operations as a whole (Eurasia consists of countries like Afghanistan, France, Germany, Kazakhstan, Kyrgyzstan, Serbia, Turkey, Ukraine, Uzbekistan, UAE, and many more).
It is quite surprising how significant revenues from UAE are enabling the company to get such great revenues from Eurasia. In this context, the company is also investing in Eurasia’s market (and so on UAE’s market) to gain the advantage of the rising sales by extending the foreign direct investments together with the capital expenditures. All these information have provided in the table below; it is essential to note that all figures are in millions:
The Problems to Coca-Cola Company
- Damyanova and Thomas (1) argued that Coca-Cola might lose its UAE shares for local rivals
- People of UAE often see Coca-Cola as an Israeli company as it had divisions in Israel; so, they often reject the business; moreover, UAE’s people also think that staying away from Coca-Cola is a protest to USA and USA’s (international) strategies
- Rumors are present which suggests Coca-Cola consist substance making it incompatible for Muslims and that anti-Islamic ads appear in posters (like “No Mohammed, No Mecca, only Coca-Cola”)
- Coca-Cola’s ads in UAE are often inappropriate to the Islamic values of UAE, so threats of losing market arises.
Works Cited
ADB. Foreign Direct Investment in Pakistan: Policy Issues and Operational Implications. 1999. Web.
Ahmad, Sufian. & Khan, Ullah. Term Project Marketing Strategy: Marketing Strategies of Coca Cola. 2002. Web.
Alfaro, Laura. Foreign Direct Investment and Growth: Does the Sector Matter. 2003. Web.
AlGharaballi, Talal. UAE Economic Outlook 2010. 2011. Web.
AMF. Population of member countries. 2007. Web.
Bevan, Alan. & Estrin, Saul. The Determinants of Foreign Direct Investment in Transition Economies. 2000. Web.
Chilton, John. Countries ranked by GDP per capita. 2011. Web.
CIA. The World Factbook. 2001. Web.
Coca-Cola Company. Annual Report of 2010. 2010. Web.
Damyanova, Boryana. & Singer, Thomas. The Role of Multinational Companies in Dubai: Balancing Tradition and Modernization. 2003. Web.
DED. FDI: Dubai. 2010. Web.
GCC. United Arab Emirates. 2009. Web.
Global Office. Massive Free Zone FDI Growth. 2011. Web.
IMF. IMF Executive Board Concludes 2011 Article IV Consultation with United Arab Emirates. 2011. Web.
Index mundi. United Arab Emirates Economy Profile. 2011. Web.
Index mundi.United Arab Emirates Population. 2011. Web.
Istaitieh, Abdulaziz. Hugo, Sarah. & Husain, Natasha.UAE Macroeconomic Report. 2007. Web.
Library of Congress. Federal Research Division Country Profile: United Arab Emirates. 2007. Web.
Ligaya, Armina. Coca-Cola wants to pop decades-old price tag. 2010. Web.
MEES. GDP as per sector at current prices: United Arab Emirates. 2006. Web.
Moore, Michael. The US-UAE Trade and Investment Relationship. 2008. Web.
National Bureau of Statistics. Analytical Report on Economic and Social Dimensions in the United Arab Emirates. 2010. Web.
OECD. National Investment Reform Agendas. 2006. Web.
PWT. United Arab Emirates. 2004. Web.
RAK. Foreign Investment in the UAE. 2010. Web.
The New York Times. Like to Sell the World a Coke.2007. Web.
The World Bank Group. United Arab Emirates. 2011. Web.
UNCTAD. Project information: United Arab Emirates. 2002. Web.
UN. Permanent Mission of the United Arab Emirates. 2011. Web.
World Economic Forum. The United Arab Emirates and the World: Scenarios to 2025. 2007. Web.
WTO. United Arab Emirates and the WTO. 2011. Web.