Examining the statistical significance of the relationship between variables is the basis for a robust study that works with the data. This paper uses a survey of a sample of 182 students to identify potential relationship effects between pairs of variables, namely, physical health and life satisfaction. Relationships are evaluated for relevant effects based on the nature of the variables, as well as the level of statistical significance to postulate whether the relationship was reliable.
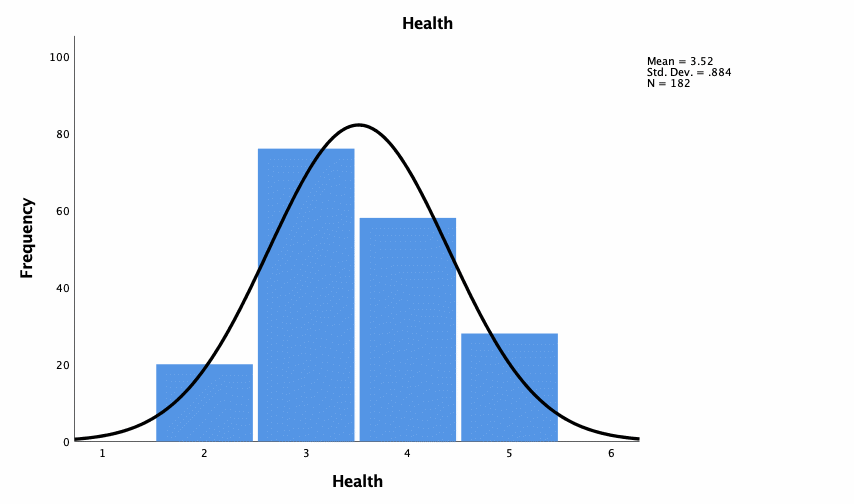
The primary objective of the analysis is the use of descriptive statistics. Table 1 shows measures of central tendency and measures of variation for each of the variables used and the level at which they are measured. Based on these results, we find that the average level of life satisfaction for this sample was 25.86, which is rather low overall, given the survey’s hundred-point scale. In addition, in the context of physical health, respondents were often inclined to classify their health as “good,” that is, at an average level of measurement. Table 2 shows the frequency distributions for the nominal variable, and Figure 1 shows histogram of that distribution.
Table 1: Summary of descriptive statistics for the variables used.
Table 2: Frequency distribution for nominal variable (Note: none of the participants chose “Poor”)

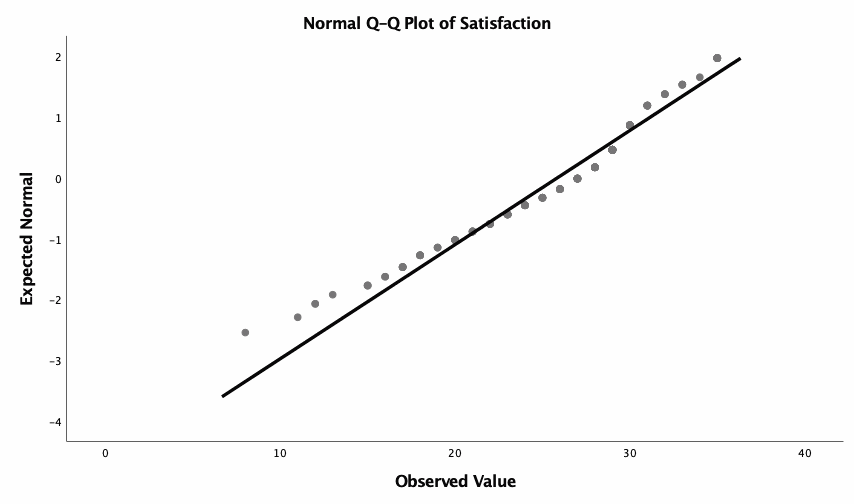
Trends for distribution normality were also evaluated for scale variable. Table 3 shows the results of the Kolmogorov-Smirnov, Shapiro-Wilk test, and Figure 2 shows Q-Q plot for that distribution (Korstanje, 2019). From the data, it can be concluded that Life Satisfaction distribution was normal because the corresponding statistical values were statistically significant (p <.05). The skewness coefficient was also calculated to confirm the normality of the distribution of the variable. For Physical Health, the skewness coefficient was 0.144, which is not significantly different from zero and confirms the normality of the distribution.
Table 3: Normality test results for the Physical Health distribution (Note: * — p <.05).

It is worth clarifying that classical ways of determining the relationship between variables include correlation and regression analysis, but in both cases, it is necessary to make assumptions about the continuity of the variables. Such tests cannot be applied to nominal variables. In the relationship of physical health and life satisfaction, physical health is represented by a nominal scale with four dimensions; in fact, the variable was represented by five levels, but the Poor category was not selected by any of the respondents, so this subgroup is not used for the analysis. Hence, a one-way ANOVA will be used in this case. The results of this test (Table 4) do not allow us to reject the null hypothesis because F(3, 181) = 1.228, p =.301. In other words, in this case there is insufficient evidence to suggest that there are meaningful differences in life satisfaction between levels of physical health. This means that there is no relationship between the variables for this sample at the 95% significance level.
Table 4: One-way ANOVA results for Physical Health and Life Satisfaction.
Reference
Korstanje, J. (2019). 6 ways to test for a Normal Distribution — which one to use?TDS.