Goals and Objectives
The primary purpose of this paper is to determine whether or not it is beneficial to make financial investments in software programs that manage parking spaces. In addition, it investigates whether or not the application for parking spaces will have a constructive effect on the administration of cities.
Since there are more vehicles in modern cities, drivers may have difficulty locating parking places most of the time. It is caused by the increase of automobiles in these places. Most drivers look for a parking lot, but the parking lots fill very fast, which makes them waste a lot of time and energy. As a consequence of this, there is a pressing requirement to devise an appropriate procedure that will enable drivers to easily locate parking spaces.
Occupancy Rates for Each Day
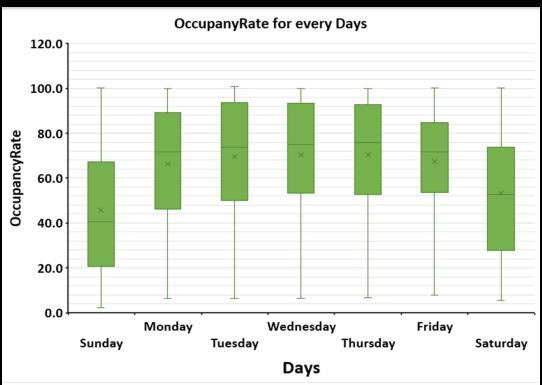
Various days of the week are broken down into box plots to display their respective occupancy rates. This graph displays the occupancy rates for the entire week and also displays the occupancy rates for each individual day.

The box plot of the occupancy rate and days is shown in Figure 1. This plot consists of five synopses, including the lowest range, the first quartile, the median, the third quartile, and the maximum range. According to the findings, the median occupancy level is almost the same throughout the weekdays and lower over the weekends, with Thursdays and Wednesdays displaying the most significant degree of occupancy. According to these findings, the city never stops being hectic throughout the weekdays, and there are often long waits for parking spaces.
Interpretation of the Box Plot Results
The median occupancy rate varies from week to week, which indicates that the rate varies depending on the day of the week as well as the time of day.
The median occupancy rate for the two days of the week, Monday and Friday, is exactly the same.
The occupancy rate is lowest on two days of the week, notably Saturday and Sunday, in comparison to other days of the week, and this is because of several national and religious holidays.
Conclusion on the Box Plot Results
According to the box plot, this pyramid encompasses the highest occupancy rates all the way down to the lowest occupancy rates. All the days are taken into account. In conclusion, the occupancy rate increases gradually as the week starts and reaches its peak in the middle of the week, and decreases gradually as the week ends. The conclusions provided are based on a search of a database of parking lots.
Occupancy Rates for Every Parking Lot
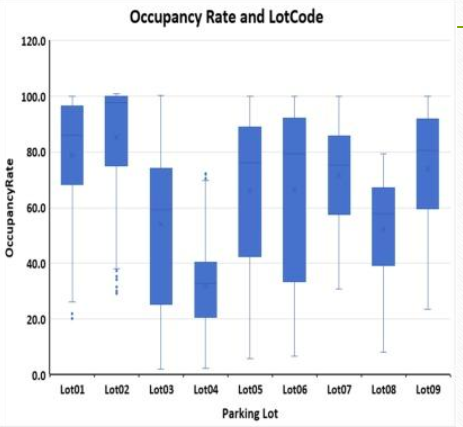
This box plot analyzes the findings for each parking lot, starting with Lot101 and going all the way down to Lot09. There is a breakdown of the occupancy rates for each lot, broken down by day and hour.

The findings of the investigation into the relationship between the occupancy rate and the lot code are presented in Figure 2. According to the findings of the research, the majority of parking lots do not have parking rise rates. In addition, it was discovered that certain parking lots are used significantly more frequently than others. As an illustration, lot code 06 has a greater number of car visits than lot code 04, which has the lowest number of car visits.
According to the findings of the investigation, there was no significant association between the rates for Lot Code 01 and the time that was provided. This goes against what most people believe to be true about the Lot Code. It is anticipated that the occupancy rate will shift as time goes on.
Occupancy Rate against Time for Lot01

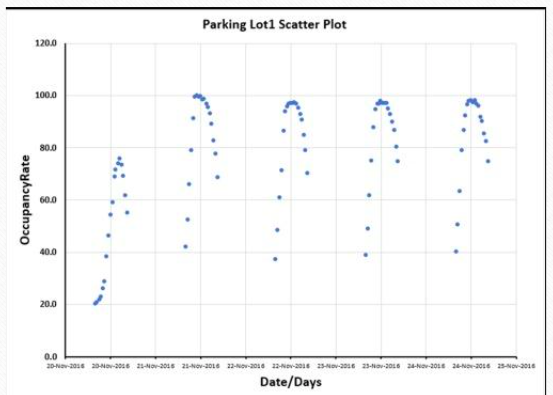
This scatter plot illustrates the data for the specified occupancy rates were collected from November 20th to November 25th, 2016. The figures demonstrate that the most noisy parking occurs during peak hours at 12:57 in the afternoon on each day of the week.
The chart shows that there is a direct correlation between time and the occupancy rate. It is evident from the scatter plot that the middle of the day on all days is very busy for the parking lot of the auto dealership. When compared to other times, 12:57 appears to have the highest occupancy rates. Yes, the outcomes that should be anticipated are the same as in the past.
Interpretation of Results on Occupancy Rate Against Time
The scatter plots show that the occupancy rate in each parking lot is different from one another. The number of vehicles parked in each parking lot is subject to a unique occupancy rate. The median occupancy rate for Lot04 is the lowest, while the rate for Lot06 is the highest.
Lot03, Lot05, and Lot06 in the parking lot are used more often than the other lots. The anticipated outcomes are deduced from the results that are anticipated to occur in the parking lots. The parking flow is greater in the lots that have a larger box area, whereas the parking flow is lower in the lots that have a smaller area.
Recommendations
On weekdays, occupancy levels tend to be around the same; on weekends, however, occupancy levels are often much lower. On the other hand, there is a link in the other direction with lot codes. This is because, according to the median inspection, it did not exhibit any signs of consistency. In conclusion, the municipality requires an application in order to ensure an adequate occupancy rate across all of the parking lot codes.
References
Jilani, A. K. ( 2018). Smart virtual parking mobile application. Journal of Information and Optimization Sciences , 39, 15-30.