Introduction
Background to the study
This report entails a return-risk analysis using various methods learnt from the portfolio theory. The analysis is conducted by evaluating shares from four main companies listed in the London Stock Exchange. The companies selected operate in different industries and sector. Decision to select companies from different sectors was informed by the need to develop a diversified portfolio. The investment portfolio is developed by calculating the return and risk and the optimal weights. Markowitz efficient frontier and the correlation analysis approaches are used in analysing investment options from the three companies.
The first part of the report entails a general overview of the three companies. A brief background, share price analysis and risk and return analysis with regard to the three companies is conducted. The three companies selected include BT Group PLC, Barclays PLC, and British Petroleum PLC. Research on the FTSE 350 index, which is used to evaluate the performance of the 350 largest companies listed in the London Stock Exchange, is also conducted. Thus, an overall idea of the prevailing market performance is obtained.
Moreover, different methodologies have been utilised in order to determine the most optimal portfolio to invest in for optimal returns. The methodologies have played a critical role in identifying the degree of risk exposure of each portfolio due to market changes. The main methods of analysis used include CAPM hypothesis, correlation analysis, and Markowitz efficient frontier selection method. The figures used such as the historical price of shares with regard to the three companies are obtained from reputable online organisations, which focus on financial issues. Some of the websites used include, uk.finance.yahoo.com, ft.com, and the London Stock Exchange.
Key questions
This study is aimed at conducting a comprehensive analysis on how to develop the most optimal investment portfolio comprised of shares from three different companies, which include Barclays, BT Group and British Petroleum. To achieve this, the study mainly focuses on two main elements, which include the risk and return. Three main standards of measurements, which include CAPM, correlation, and efficient frontier method, are used. Moreover, the study is undertaken by taking into account a number of questions, which are outlined below.
- What are the mean annual returns of the three shares considered in the portfolio?
- What are the main risk characteristics of each of the three firms’ shares considered in the portfolio?
- What optimal weights of the three companies considered in the portfolio would minimise risk and maximise returns?
- How can the relationship between the firms’ returns with regard to shares and market returns be described using the FTSE 350?
Background of the shares
Our portfolio is comprised of shares from three companies, which include BT Group PLC, Barclays PLC, and British Petroleum PLC. The three firms are listed in the London Stock Exchange [LSE]. This segment outlines a brief profile of the three companies.
BT Group PLC
BT Group PLC is a British wireless telecommunication company that was founded in 1980. The firm’s origin can be traced back to 1846 with the establishment of the Electric Telegraph. The firm’s headquarter is located in London, United Kingdom. The firm operates as a multinational corporation in over 170 countries. The firm is ranked amongst the leading telecommunication service companies globally. Its direct competitors include Cable & Wireless Worldwide PLC, Vodafone Group Public Limited Company, and Deutsche Telekom AG. BT Group PLC is listed in the New York and the London Stock Exchange markets. In the UK, the firm is a constituent of the FTSE 100 index.
Source: (London Stock Exchange, 2013)
Barclays PLC
Barclays Plc is a multinational financial services and banking firm that was founded in 1690. The firm operates in the UK banking and financial services industry and its headquarters are located at London, UK. The firm has established subsidiaries in over 50 countries. Its customer base is estimated to be 48 million. The firm’s operations are organised into three main business clusters, which include Retail and Business Banking, Corporate and Investment Banking and Investment and Wealth Management. The firm is listed in London stock exchange.
British Petroleum PLC [BP]
BP is a British multinational company that operates in the UK oil and gas industry. The firm was established in 1909 under the name Anglo-Persian Oil Company. The firm has changed its name a number of times to its current name, BP plc. BP’s headquarters are located in London, UK. By the end of 2012, the firm was ranked 5th largest oil and gas companies in the world with reference to revenue and 6th with reference to production. The firm’s major competitors include Royal Dutch Shell plc, Exxon Mobil Corporation, and Chevron Corporation.
Market index: FTSE 350
FTSE 350 is a weighted stock market index that is used to determine the performance of firms listed in the London Stock Exchange market (LSE). The index is a combination of the largest 350 companies listed in the LSE based on their market capitalisation. These indices include the FTSE 250 and the FTSE 100 index. The FTSE 100 index is used evaluate the performance of 100 biggest companies while the FTSE 250 is used to evaluate the performance of the next largest 250 companies.

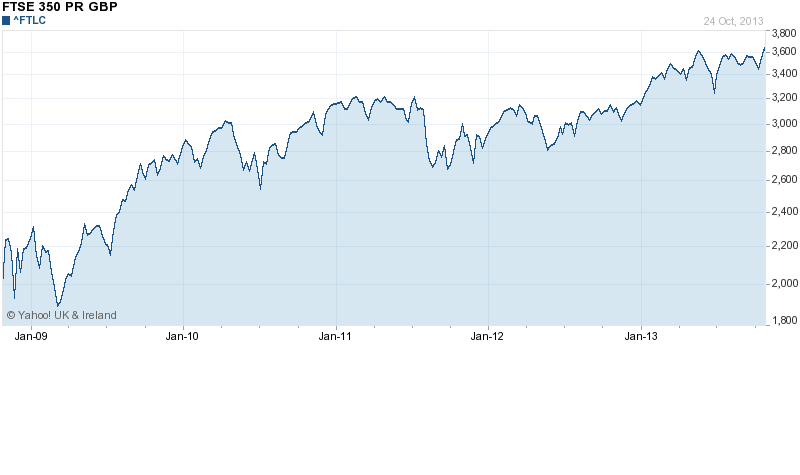
The graph shows that the FTSE 350 index has undergone significant flactuations over the past five years. Thus, one can assert that the FTSE 350 index is characterised by a hihg degree of volatility. For exmple, in 2009, the index reached a low of 1978.95 points. The decline is associated with the 2008/2009 global economic recession. The recession had adverse effects on firms’ performance and hence the decline in the index perforamance. However, the poor performance of the index was shortlived as illustrated by the upward trend of the index. The index performed positively until June 2010 when it declined again.
This decline is associated with the poor performance of the pension scheme. By the end of June 2010, the FTSE 350 pension scheme had a deficit of £85 billion. However, the index recovered as a result of growth in the global equity market. The recovery led to improvement in the value of the assets held by the companies in the pension schemes. By April 2011, the FTSE 350 reached a high of 3223.52 points and then declined to a low of 2711.63 points. By the end of 2011, the index had already stabilised and continued on an upward trend. However, minimal flactuations occured as a result of pressure from the sovereign Eurozone crisis and the debt crisis.
Portfolio diversification
Investing in a single portifolio presents a major risk in the financial peromance of a firm. This highlights the importance of diversifying investments in order to mininise the various types of market risk. Diversification also enables an organisation to maxmise its return. Most organisations have diversified their investment portfolio (Stoyanov, 2005). Similarly, our portfolio will be comprised of shares from different companies. The table below illustrates a summary of how the three firms have diversified their invesment.
Prices and returns: summary statistics
This report utilises market data ranging from January 2009 to January 2013. Consequently, major market events that have occurred over the past few years and their effect on the share price are considered. The stock price indexes relate to shares of the three companies, BT Group, BP, and Barclays.
BT Group

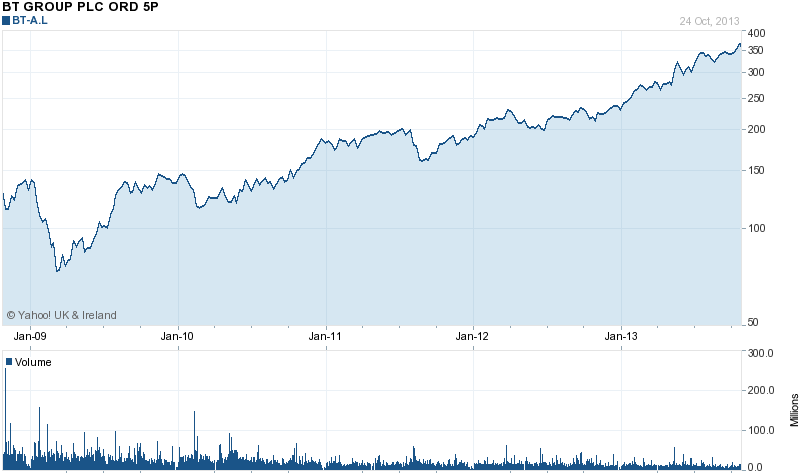
BT Group operates within the technology sector. Thus, the firm is subject to market changes considering the volatility in the technology industry. Innovation within the telecommunication industry presents a major threat both small and large enterprises in the industry. The chart above shows that the movement of BT Group share price is aligned to the movement of the FTSE 350. BT Group share index was relatively stable from mid 2009. One of the factors that have stimulated increment in the company’s share relate to adoption of an attractive dividend policy. The firm has a policy whereby a substantial amount of the company’s earnings is passed to the shareholders as dividends. However, the amount issued as dividend varies from one year to another. The company’s dividend policy has attracted many investors. The company pays dividend twice a year. The company paid out 5.7 pence and 6.5 pence as dividends during its 2011/2012 and 2012/2013 financial years (BT Group, 2013).
Barclays

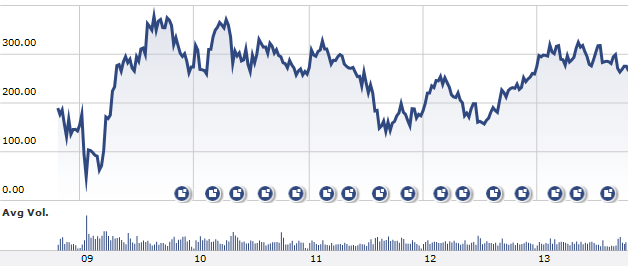
Barclays has experienced positive financial performance since 2000. Some of the factors that enhanced the firm’s financial performance relates to acquisitions made by the firm. However, the bank was adversely affected by the 2008 global financial crisis. Consequently, Barclays was forced to seek financial assistance from the UK government. The firm’s attempt to acquire Lehman Brothers during the same period failed. This had adverse effects on the company’s performance and hence its share price. In an effort to recover from the crisis, Barclays sold its Barclays Global Investor unit to BlackRock in 2009. The sale increased the firm’s profit by £ 6,331.
British Petroleum
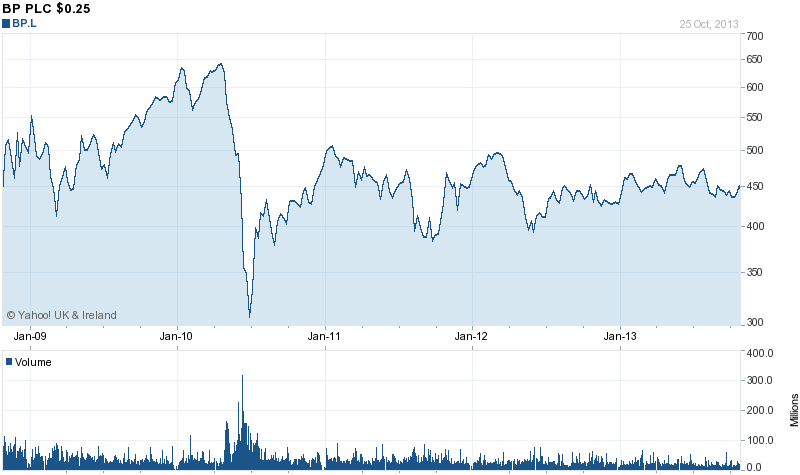
The chart below shows the performance of BP share price. From the chart, it is evident that the company experienced a positive financial performance from January 2009 to June 2010. This is evidenced by the upward trend in the share price performance. However, the company experienced a significant decline in its share price in June 2010. One of the reasons that explain the decline in the company’s share price is the oil spill that occurred in the Gulf of Mexico. The oil spill cost BP PLC $350 million (Skoloff & Wardell, 2010). The firm was required to undertake a comprehensive cleanup exercise in addition to being fined approximately $3 to $5 million by the US government. Despite the cost associated with the oil spill, the firm was able to recover. The firm’s recovery is associated with the firm’s effectiveness in managing the crisis. The firm regained its profitability trend as illustrated by the chart below. However, the firm’s share price was subject to fluctuation because of the high volatility in the oil industry (Financial Times, 2013a).

Table 1: Descriptive statistics for the three share returns, January 2009 to October 2013.
In an effort to obtain an effective and efficient description of the three shares, a simple description of the performance of the three shares was obtained. This was achieved by determining the shares returns’ standard deviation, the maximum returns, minimum returns, variance and the coefficient of variation as illustrated in table 1 above.
From table 1, it is evident that Barclays has the highest average returns [2.25%] followed by BT Group with an average monthly return of 0.8%. BP has the lowest average monthly returns of 0.54%. Despite this, the three firm’s average annual returns were above the FTSE 350 index. On the other hand, the variance of the three companies share shows that Barclays has the highest variance of 0.0254 compared to that of BT Group, which is the lowest [0.0034].
These values show that Barclays is very effective with regard to offering returns to its investors. However, the table shows that Barclays share returns have a high degree of standard deviation and coefficient of variation. This illustrates the degree of risk associated with investing in the firm’s shares. Financial institutions in the Euro Zone have increasingly become exposed to external market pressures such as the sovereign debt crisis in the Euro Zone. Consequently, the likelihood poor financial performance is high. BP has the lowest degree of risk as illustrated by the variance and the standard deviation (Financial Times, 2013b).
Coefficients of variations are calculated in order to determine the edge of risk tradeoff associated with the three shares. The results are illustrated by the descriptive statistics in table 1. The table shows that Barclays has the highest coefficient of variation of 5.39. BP has the second highest coefficient of variation of 5.34 while BT Group has the lowest coefficient of variation of 4.25. The coefficient of variation shows that investing in Barclays is relatively risky compared to BT Group and BP.
Correlation analysis
Table 2: Correlation values for the four shares, from 2009 to 2013.
Table 3: Correlation analysis of the three companies shares based on two ranking, that is, weak and strong.
Determining the degree of correlation is one of the ways through which investors can determine the most appropriate shares to invest in for good returns. Correlation analysis refers to the process of determining the relationship between two variables. Correlation analysis is used to determine the degree to which change in one attribute or variable influences change in another variable (Kevin, 2009).Table 2 above shows the degree of correlation between the three shares from January 2009 to October 2013. The table also illustrates the FTSE 350 index.
Decision to calculate correlation values between three shares is informed by the need to construct the most optimal investment portfolio. Kevin (2009) is of the opinion that one characteristics of an optimal investment portfolio is diversification. Kevin (2009) assets, “Adding securities to a portfolio reduces the degree of risk associated because the securities are not perfectly positively correlated” (p.165).
Thus, diversification enables investors to reduce the degree of risk associated with a particular security. Two main types of risks are inherent in securities and they include the systematic and unsystematic risk. The systematic risks are comprised of risks that are related to changes originating from the market. On the other hand, unsystematic risks include the risks that are associated with the unique characteristic of risk. Combining securities with varying risk characteristics minimises both the systematic and the unsystematic risks.
The risk associated with a particular investment portfolio is reduced as the number of securities in the portfolio increases. Upon reaching a particular level, only the systematic risks associated with the securities are left in the portfolio. Kevin (2009) further argues that it is difficult for an investor to eliminate systematic risk by constructing a particular investment portfolio. Therefore, most investment portfolios are comprised of systematic risks and minimal unsystematic risk.
Table 2 shows the correlation values between the returns of BT Group, Barclays and British Petroleum shares. From the table, it is evident that the correlation values range between 45.84% and 92.49%. However, the highest correlation value is with regard to Barclays and BT Group. One of the reasons that can explain the high correlation values between the two values is that they are key constituents of the FTSE 250 index. Consequently, the likelihood of the two companies’ performance moving in the same direction with regard to financial performance is relatively high.
Another reason that explains the high correlation values is that the shares of the two companies are subject to a high degree of volatility emanating from the external market. For example, the financial performance of BP is very volatile to changes in the macro environment such as political instability and change in the global oil prices. On the other hand, the performance of Barclays is also subject to the occurrence of a financial crisis. This is well illustrated by the fact that the firm was adversely affected by the 2008 global economic recession. In an effort to recover from the recession, the firm was forced to borrow from the UK government through the Bank of England.
On the other hand, BT Group is not very sensitive to market changes. From table 2 and 3 above, it is evident that there is a strong degree of correlation between BT Group and Barclays (92.49%). One of the factors that explain the strong correlation between the two companies is the high level of market capitalisation between the two companies. The two companies operate as multinationals in different countries. Consequently, they have managed to develop a strong financial stability.
The correlation between BP and the other two firms, i.e Barclays and BT Group is relatively weak. The lowest degree of correlation between relates to that of BP and Barclays, which is approximately 45.84%. The difference with regard to their correlation can be explained by the fact that they operate in different economic sectors. Moreover, one of the firms [Barclays] is service oriented while BP mainly deals with tangible products. Thus, the two firms are affected by different market forces. Moreover, consumers’ decision to purchase the firms’ products vary.
Construction of the portfolio using the efficient frontier approach
The Markowitz portfolio theory is used to explain how investors can construct a diversified investment portfolio. Therefore, diversification is the main element postulated by the theory. The theory is also known as the mean-variance theory. The theory postulates that investors make their investment decisions based on return and risk associated with a particular investment portfolio. To achieve this, it is important for the investor to determine the variance and mean associated with the securities in the portfolio.
Moreover, the theory asserts that it is important to construct a portfolio by incorporating securities from different sectors. Investing in securities from a single sector may limit the likelihood of maximising returns. Kevin (2009) asserts, “Investing in many securities is not the right diversification by itself, because the securities returns might have a high correlation values with one another” (p.27). For example, investing in 100 technology securities does not amount to diversification
The theory discredits the tenet of discounted expected maximisation of return. On the country, the theory postulates that the discounted expected return maximisation assumption does not integrate the element of diversification, which is an important element in the process of constructing an investment portfolio. The theory asserts that determining the variance or standard deviation with regard to a particular investment return is the most effective in assessing the likelihood of a particular investment.
The Markowitz portfolio selection model has been integrated in the process of selecting the most optimal investment portfolio with regard to shares belonging to the three companies. By using the theory, it was possible to determine which of the three shares have the highest probability of generating high return. The risk associated with the shares was also taken into account.
Using the Markowitz efficient frontier, a portfolio of the expected returns with regard to the three companies is constructed. This has been achieved by ensuring that the returns are maximised while the risks is minimised. Table 4 illustrates a summary of the investment portfolio. Panel A illustrates the portfolio weights while panel B shows the expected returns and variance. An expected return of 0.15% and a standard deviation of 6.40% are illustrated. On the other hand, the three companies have different weights, which include BT Group (26%), Barclays (35%), and BP (22%). From these results, it is imperative for the portfolio to be comprised of shares from two main companies, which include BT Group and Barclays. The table below illustrates a summary statistics and correlation with regard to the three shares.
From the table above, it is evident that the mean annual return of the three shares is 0.15%. On the other hand, portfolio has a standard deviation of 6.4%, a variance of 0.08% and a coefficient of variation of 30.6. This shows that the variance of the portfolio (0.08%) is relatively low as compared to individual variances of the three shares as illustrated by table 1. Thus, the risk in the portfolio is adequately minimised.
Conclusion
The analysis shows that it is important for investors to construct an optimal investment portfolio. In a bid to achieve this goal, it is imperative for investors to conduct an in-depth analysis of the company that they intend to invest in for better returns. If the firm or firms are listed in the stock exchange market, it is prudent for the investor to evaluate the firm’s performance with regard to the prevailing stock market index.
In this report, an evaluation of BT Group, Barclays, and BP is undertaken by comparing their performance with the FTSE 350 index. Such comparison aids in determining the performance of the company relative to the market. Moreover, it is also important for investors to diversify their investments. This can be achieved by investing in securities of companies in different economic sectors. In this report, companies from different economic sectors are considered. Such diversification will aid in the development of an optimal investment portfolio. For example, it will be possible to minimise the unsystematic risk associated with each of the securities considered.
In addition to effective diversification, the investor should asses the attractiveness of the securities by evaluating their prices and returns. This can only be achieved if effective investment models are integrated. Some of the models that should be considered include the CAPM hypothesis, correlation analysis, and Markowitz efficient frontier selection method. These models will aid in determining whether investing in the selected securities has led to maximisation of returns and minimisation of risks.
Recommendations
From the analysis, it is evident that investing BT Group and Barclays securities will lead to maximisation of returns. This arises from the fact that the two securities are characterised by a relatively low level of standard deviation and variance compared to that of BP. Continuous evaluation of the two shares performance will be conducted. This will aid in identifying possible risks that might limit the likelihood of maximising the returns from the two securities. Moreover, it is critical for investors to consider investing in securities of firms in other economic sectors other than the sectors considered in this report. This will enable the investor to construct an optimal investment portfolio hence maximising returns.
Reference List
BT Group. (2013). Company profile. Web.
Financial Times. (2013a). Equities, BP PLC. Web.
Financial Times. (2013b). Equities, BT Group. Web.
Kevin, S. (2009). Security analysis and portfolio management. London, UK: PHI Learning.
London Stock Exchange. (2013). Barclays share chart. Web.
Skoloff, B., & Wardell, J. (2010). BP oil spill cost hits $40 billion, company returns to profit. Web.
Stoyanov, S. (2005). Diversification matters: efficient portfolio construction in the prescence of a risk free asset. Web.
Yahoo Finance. (2013b). BP PLC, key statistics. Web.