- Problem Statement
- Your Team and the Assigned Team
- Hypothesis Test for the Population Mean (I)
- Hypothesis Test for the Population Mean (II)
- Hypothesis Test for the Population Proportion
- Descriptive Statistics for Relative Skill of Lakers
- Descriptive Statistics for Relative Skill of Celtics
- Confidence Interval for Average Relative Skill of Teams in the year 2013 – 2015
- Reference
Problem Statement
The main aim of this project is to analyse how different basketball teams in USA under the National basketball Association (NBA) performed over the years. The results of the data analysis will assist the management assess key areas for performance improvement. The techniques applied were descriptive statistics, confidence intervals, and data visualization, while appreciating the python programming language. Data set was obtained from the NBA was categorical to the; NBA Team, year of specific games, points scored, and average level of the competence of the team. Under descriptive statistics, the following were analysed; mean, median, min, max, variance, and standard deviation.
Your Team and the Assigned Team
For this project, the team picked was Lakers for the period between 2013 to 2015. The team that was assigned for this project is Celtics, for the period between 1996 to 1998.
Hypothesis Test for the Population Mean (I)
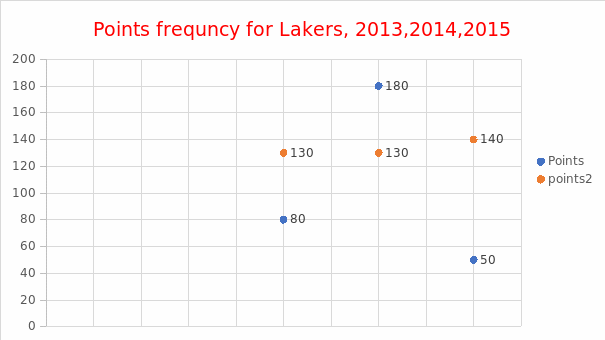
Data visualisation refers a data representation method where data is analysed with the aid of graphical tools, i.e., graphs, flow charts, maps, histograms, etc. Data visualization assist in the interpretation of data and finding to members who are not conversant with computer language analytics. To analyse my team’s performance for the period 2013-2015, I opted for a scatter plot model for elaboration. Scatter plot are effective when just one team is being analysed. The graph shows the number of points scored by Lakers during the period mentioned above.

From the scatter plot we see that Lakers scores in 2013 ranged from 80 to 130. In 2013 their scores ranged from 180 to 130, then finally in 2015, their scores ranged from 140 to 50 points. We can conclude from the scatter plot that the performance of the team is not consistent and is steadily decreasing. The mean score for the period is approximately 103 points.
Hypothesis Test for the Population Mean (II)
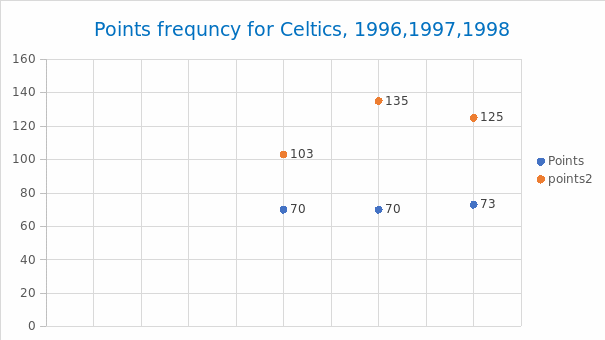
The same visualisation technique was applied, i.e., scatter plot for the that was assigned, (Celtics) for the period 1996-1998. The results of the scatter plot show that the team’s score for the year 1996 varied from 70 to 103. In the following year, the team’s score ranged between 70-135. In the final year of analysis, the team had scores between 73-125. While their performance was rather steady, it was decreasing slowly with an average of 100 points for the three-year period.

Hypothesis Test for the Population Proportion
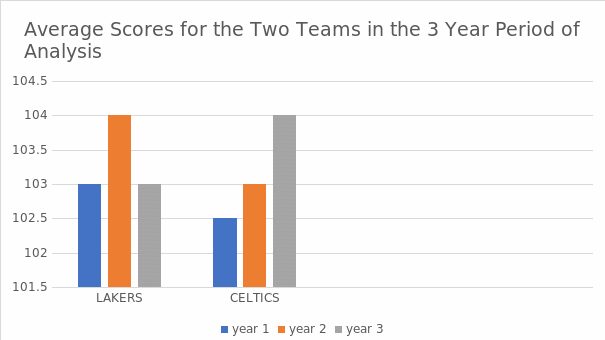
As mentioned earlier data visualization tools are used to understand data from complex application and raw data. When comparing the two team, Lakers and Celtics, visualization techniques and tools are important for the understanding. The average points for Lakers are meagrely higher than that of Celtics as per the graph below. Notably the median for the Celtics is similar to that of Lakers at 103. Both teams record high level of performance in the final year of analysis, 2013, 1998 for Lakers and Celtics respectively, however the Lakers show better performance compared to Celtics with steady and higher performance in former years of analysis.

Descriptive Statistics for Relative Skill of Lakers
The table shows the results of calculations of central tendencies, mean, median, variance and standard deviation for the Lakers Team for the three years of analysis. From the calculations, the mean of 1649 was arrived at by summing the total points scored and then divided by the score counts. The median of 1660, is the mid-score points value for the team. The variance of 3410 was calculated by finding the square difference of the mean, then getting their average. The standard deviation of 58.40 is the square root of variance. A low standard deviation suggests that values are close to the mean value. The median is will be favourite to represent the centre of deviation.
The table shows the results of calculations of central tendencies, mean, median, variance and standard deviation for the Celtics Team for the three years of analysis. The mean score for the team was 1649, calculated by dividing the summation of points scored by the score counts. The median value is the mid-score value of points scored by the team. The standard variation which was 58.40 was arrived at by finding the square root of the variance of 3410. The median is higher than the mean, the data is skewed to the left. The median value will be used as the central deviation, as it is higher than the mean value. When comparing the two teams, the lakers team beats Celtics in all the tendencies, mean, median and variance. The results show that the performance of the Lakers is better than the Celtics.
Descriptive Statistics for Relative Skill of Celtics
The table above shows confidence levels of all the team participating in the NBA during the three of analysis of the Lakers team (2013-2015). Calculated by (point estimate – margin of error, point estimate + margin of error), confidence is the probability used in calculating intervals, usually expressed as a percentage. The interval of the teams in the NBA is (1501.12, 1509.28), compared to that of Lakers at 1649. The probability of the teams having lower skill level that n that of Lakers was calculated and arrived at 0.9, with that higher than 0.05, then it cannot be considered unusual.
Confidence Interval for Average Relative Skill of Teams in the year 2013 – 2015
The table above shows confidence levels of all the team participating in the NBA during the three of analysis of the Celtics team (1996-1998). The interval of the teams in the NBA is (1487.66, 1493.65), compared to that of Celtics at 1739. The confidence interval of Celtics is clearly below the confidence levels for the whole of the teams in the NBA during that year. From the two data sets, the confidence intervals for the two periods analysed; 2013-2015 and 1996-1998, their values were (1501.12, 1509.28) and (1487.66, 1493.65) respectively. This indicates that there is a difference in the level of skills during the two periods.
Data analysis is vital for organisations and institutions as it provides basis for decision making. Data visualisation tools and technique help in better understanding and interpretation of data to management who might no be conversant with the analytic tools. From the analysis, the performance of the two teams decreases annually despite Lakers showing a level of consistency in their performance.
Reference
Kaggle: Your Machine Learning and Data Science Community. Kaggle.com. (2021).