Abstract
Thin layer chromatography (TLC) is an analytical method of separating compounds based on their solubilities in the mobile and stationary phases. This experiment aimed at using TLC to separate leaf pigments. Leaf extracts were dissolved in propanone and spotted on a TLC plate with a mixture of cyclohexane and ethyl ethanoate as the mobile phase. Three pigments were separated. It was concluded that TLC was an effective method of separation.
Literature Review
Chromatography is a distinguished method of separation used by analysts to separate compounds. It consists of a mobile and stationary phases. The mobile phase dissolves the analyte and carries it along with the stationary phase, which holds the compounds as they separate. Separation occurs due to the differences in the rates of movement of the constituents. In thin layer chromatography (TLC), a fine layer of silica gel or alumina coated with a plastic or glass is used as the stationary phase (Kumar, Sarangi, & Jyotirmayee 2013). A compound is identified by its Rf value, which is a ratio of the distance moved by the pigment to the distance travelled by the solvent.
Rf = distance travelled by compound/ distance travelled by the solvent
Plant leaves are known to contain several pigments, including chlorophylls, carotenes, and xanthophyll (Gross 2012). These pigments absorb light at different wavelengths.
Table1. Theoretical Rf values of the major pigments found in plant leaves.
The aim of this experiment was to separate plant pigments from leaves using TLC. It was hypothesized that leaves from the same plant contained different pigments and that TLC was an efficient method of isolating and identifying plant pigments.
Materials and Methods
A few leaves were torn and placed into a pestle and mortar alongside a pinch of sand and ground using a pestle. A small amount of propanone was added to the paste and ground until a deep coloured liquid extract was obtained. A faint pencil line was drawn across a TLC silica gel sheet about 15mm from the end on the non-glossy side (the line of origin). A thin paint brush was used to apply three tiny dots of the liquid extract from the mortar along the line of origin. About 8 to 10 applications of the liquid extract were made allowing each application to dry for around 30 seconds before applying the subsequent layer.
The TLC sheet was placed in a universal bottle containing solvent A (a mixture of cyclohexane and ethyl ethanoate) with the line of origin (pencil line) nearest to the bottom but above the solvent. The solvent bottle was covered, and the sheet was observed as it developed. The TLC sheet was removed from the bottle when the solvent front was about 10mm from the top of the edge of the sheet. The positions of the solvent and each pigment molecule (at the centre) were marked with a pencil line. The colours of the spots as well as the distance of the spots and solvent front were measured and recorded. The process was repeated three times to obtain three sets of data.
Results
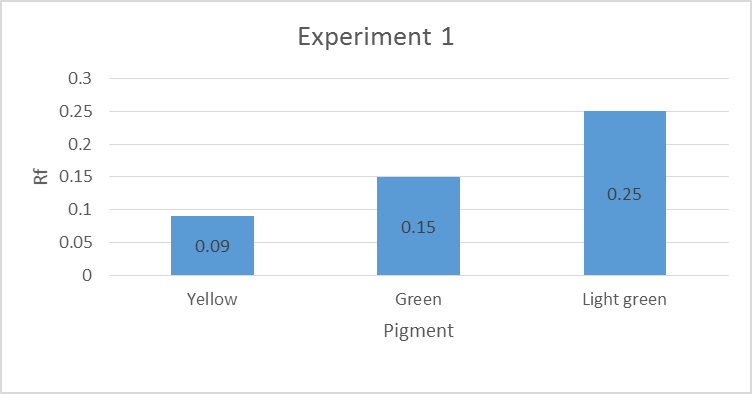
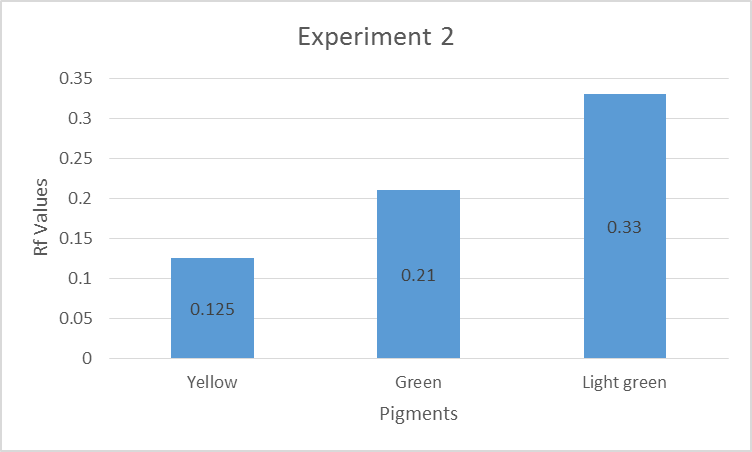
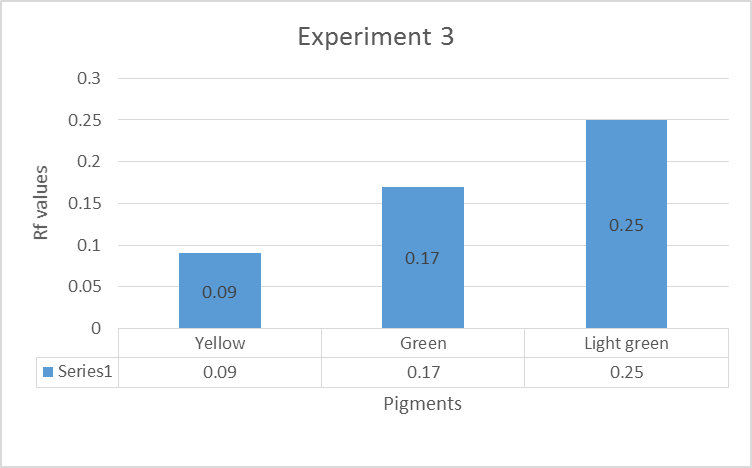
Experimental values of the Rf were calculated using the formula stated in equation 1 and compared to the literature values given in Table 1.


Three main colors were observed: yellow, green and light green. The percentage error was calculated using the formula indicated in equation 2:
Percentage error = (experimental value – theoretical value)/ theoretical value × 100
The details of the calculations are indicated in the appendices.
Discussion
The leaf extract was successfully separated into three pigments and identified based on their Rf values. These findings supported the hypotheses. The role of sand was to aid the grinding of the leaves. A pencil was used to draw the origin line instead of an ink pen because ink would dissolve in the solvent and affect the results. Repeated applications of the plant extract were necessary to concentrate the dots thus resulting in a clear separation. The extract was allowed to dry in between applications to avoid the spots from mixing due to capillary action (Sjursnes, Kvittingen, & Schmid 2014). Additionally, it was important to stop the chromatogram before the solvent reached the top of the TLC sheet to avoid losing any pigment beyond the solvent front. Similarly, the plant extract was above the solvent when the TLC sheet was placed in the universal bottle to allow the solvent to dissolve the pigment as it moved up the stationary phase for clear separation (Menzies et al. 2016).
To prove that the pigments originated from the leaves as opposed to sand, it was important to spot a mixture of sand and propanone onto a TLC sheet, run it and compare any spots with the chromatogram of the leaves.
Experiment 1 and 3 contained Carotene, Xanthophyll 2, and Xanthophyll a, while experiment 2 consisted of Xanthophyll 2, Xanthophyll 1, and Chlorophyll b pigments. The percentage errors are given in the appendices. Some of the experimental values matched the literature values, while others indicated slight discrepancies. Sources of the errors included inaccurate measurements of the distance moved by the solvent or pigments (Santiago & Strobel 2013). The mobility of the pigments in descending order was yellow, green, and light green pigment (Peters & Noble 2014). The pigments were organic hence their ability to dissolve in propanone, an organic solvent.
Conclusion
It was concluded that plant leaves consisted of different types of pigments that utilized various sunlight wavelengths for photosynthesis and that TLC was capable of separating these pigments.
Appendices
Sample calculation for the Rf value for the yellow pigment of experiment 1
Experimental value = 0.09
Theoretical value = 0.098
Percentage error = (0.09 – 0.098)/0.098 × 100 = -8.2%
TLC results for experiment 1
TLC results for experiment 2
Thin layer chromatography results for experiment 3
References
Gross, J 2012, Pigments in vegetables: chlorophylls and carotenoids, Springer Science & Business Media, New York.
Kumar, S, Sarangi, M & Jyotirmayee, K 2013, ‘Thin layer chromatography: a tool of biotechnology for isolation of bioactive compounds from medicinal plants,’ International Journal of Pharmaceutical Sciences Review & Research vol. 18, pp.126-132.
Menzies, I J, Youard, L W, Lord, J M, Carpenter, K L, Klink, J W, Perry, N B, Schaefer, H M and Gould, K S 2016, ‘Leaf colour polymorphisms: a balance between plant defense and photosynthesis,’ Journal of Ecology, vol. 104, no. 1, pp. 104-113.
Peters, R D & Noble, S D 2014, ‘Spectrographic measurement of plant pigments from 300 to 800nm,’ Remote Sensing of Environment, vol. 148, pp.119-123.
Santiago, M, & Strobel, S 2013, ‘Thin layer chromatography,’ Methods in Enzymology vol. 533, pp. 303-324.
Sjursnes, B J, Kvittingen, L & Schmid, R 2014, ‘Normal and reversed-phase thin layer chromatography of green leaf extracts,’ Journal of Chemical Education, vol. 92, no. 1, pp.193-196.