Introduction
Photosynthesis is the process by which plants and some prokaryotes, such as bacteria and algae, use the light from the sun to produce energy rich food molecules, i.e., glucose, from carbon dioxide (CO2) and water. The process also plays an important role in nature by forming a part of the nutrient cycle, e.g., the carbon, water, nitrogen, and oxygen cycles (Hames & Hooper, 2005). Since the process makes use of components of the environment, such as light, carbon dioxide, and water, it is obviously affected by these factors.
This paper tables the result of the study, which was conducted to ascertain the effect of carbon dioxide on the photosynthetic rate of waterweed. An aquatic plant was used due to its ability to absorb dissolved carbon dioxide and release oxygen, making it easy to count air bubbles evolved per minute. Terrestrial plants are devoid of both the mechanisms to sequester dissolved carbon dioxide and the ability to respire in water. In this experiment, it was hypothesized that the rate of photosynthesis rises with an increase in the concentration of carbon dioxide and went on to test the hypothesis.
It was assumed that during the experiment, the plant will be producing oxygen from photosynthesis as a byproduct and that the production of CO2 was negligible. In addition, it was imperative to use a piece of waterweed that could exude bubbles of roughly equal size at a constant rate. A suitable sprig is the one that fits in experimental vessels and that has been cut at an angle at the time of collection. Cutting at an angle enhances the ability of the sprig to absorb water and stay viable longer by keeping the xylem vessels open (Hames & Hooper, 2005).
A more accurate approach to this experiment would have been estimating the amount of gas evolved by the plant in a given time, using the photosynthometer. Other than providing knowledge on how to design and conduct experiments to explore the effect of different environmental variables on the rate of photosynthesis, this experiment was also meant to help in connecting and applying theoretical concepts in a practical setup.
Background Information
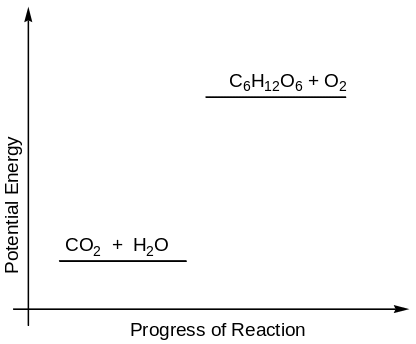
Photosynthesis results in the production of energy rich molecules as shown in figure 1 below.

The energy rich molecules produced through photosynthesis make the plant biomass that constitutes the food and fuel for other organisms. Simply stated, without photosynthesis, there would be no life on earth. The conversion of light photons into chemical energy requires the presence and action of photosynthetic pigments. These pigments are chlorophylls and the accessory pigments carotene and xanthophylls (Hames & Hooper, 2005). The chlorophylls are a diverse group of pigments, existing in a variety of forms in photosynthetic organisms.
The commonest ones are chlorophylls a and b. Chlorophyll is the preferred pigment. The chlorophyll has two functions during photosynthesis; first, it absorbs red, violet, and some forms of blue light, and second, it converts the absorbed light into the form that can be used further by cells. Hames and Hooper (2005) noted that “these functions are accomplished by a number of alterations to the basic structure of the core unit, the tetrapyrrole ring” (p. 390).
They further found out that the variations gave chlorophylls and bacteriochlorophylls a few useful characteristics. Thus, chlorophylls are capable of absorbing light at longer wavelengths than heme, are easily excited by light, and are membrane-bound (Hames & Hooper, 2005). The accessory pigments function to increase the array of wavelengths from which plants can harness energy.
Plants have leaves whose cells possess special structures, namely, the chloroplasts that are the sites of photosynthesis. Detailed studies on the structure of chloroplast have shown that the chlorophyll molecules are arranged out on pairs of parallel membranes (thylakoids) that form grana (Roberts & King, 2007). This arrangement offers maximum surface in a minimum volume.
Thus, grana harbor chlorophyll and enzymes that are involved in the light-dependent stage (photoreaction) of photosynthesis. Another part of the chloroplast that is important is the stroma. It holds enzymes for the light-independent stage (synthesis reaction) and is the site for this reaction (Roberts & King, 2007). In plant leaves, chloroplasts are mainly concentrated in the loosely packed palisade and spongy mesophyll cells, making these cells the chief photosynthetic cells. Similarly, the leaves have stomatal openings that permit the exchange of gases between the plant and the environment, ensuring that carbon dioxide is freely accessed by the plant.
The other raw material may be water or other electron donor. In this view, the process of photosynthesis is said to be either oxygenic or anoxygenic (Roberts & King, 2007). Plant roots absorb water, which is the other raw material for oxygenic photosynthesis. The xylem tissue and other specialized cells transport the absorbed water from the roots to the leaves. In this process, light energy transfers electrons from water to carbon dioxide, which produces carbohydrates and oxygen. On the contrary, anoxygenic photosynthesis uses other molecules such as hydrogen sulfide as electron donors. In this regard, it does not yield oxygen.
The process of oxygenic photosynthesis can be summarized in a simplified equation as shown below:

From the equation, one can tell that the rate of photosynthesis can be measured by either monitoring consumption of reactants such as carbon dioxide and water, or by monitoring the rate of products, namely, carbohydrates, or oxygen released. In the present experiment, the investigator focused on the oxygen emitted because it constituted the measured variable in the experiment. In the aquatic plants, oxygen production can easily be visualized as bubbles of air rising to the surface of the water.
Thus, calculating the bubbles of oxygen that are produced in a given time can be used as a measure of the rate of photosynthesis in a plant. In aquatic environments, CO2 is often in short supply for the plants that grow there because the gas is very soluble in water but has a slow diffusion rate once in solution form. Therefore, insufficient carbon dioxide may be a limiting factor in the growth rate of plants inhabiting such areas. Hydrogen carbonate ions constitute one source of CO2 and contribute to its concentration in water, as it constitutes the minerals found in soils, rocks that form the floor of water bodies, and rainwater.
Materials and Method
In this experiment, carbon dioxide was added into a beaker with water containing a branch of waterweed. The branch of waterweed was placed in a transparent cylinder and a test tube was inserted inside the water and held by a stand. Different rates of carbon dioxide, i.e. 3ml, 6ml, and 10ml per 600ml of water were used. The investigator used a stopwatch to measure time in intervals of 5 minutes for each treatment and counted the amount of air bubbles produced by the plant as it photosynthesized.
Results/Process Data
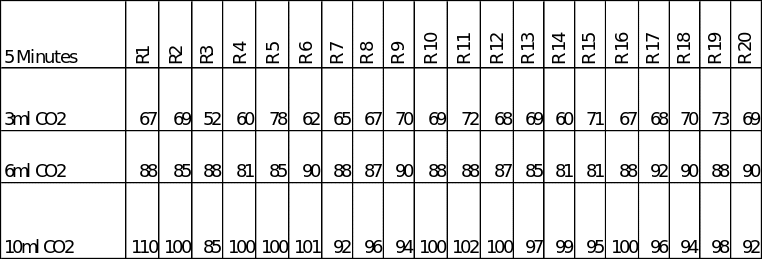
As stated above, three different rates of carbon dioxide in 600ml of water were used and the amount of oxygen evolved by the plant measured in a 5-minute time span in each case. The raw data obtained during the experiments is presented in table 1 below.

A table showing the raw data obtained during the experiments. (R1 = Round 1, etc)
Processed Data/Sample Calculations
The datasets were used to compute different parameters to analyze the rate of photosynthesis in the waterweed under different conditions of carbon dioxide and the results illustrated in tabular and graphical forms as shown. The mean/average number of bubbles of oxygen produced is computed using the formula
For instance, the sum (∑) of all oxygen counts at 3ml CO2/600ml concentration is 1346. Dividing this result by the number of rounds the counts made (n), which in this case was 20 gives a mean of 67.3.
Mean = 1346/20 = 67.3.
Thus, the mean is 67.3 as shown in the table. The same was done for the data on other concentrations to obtain their means. A similar approach was employed to calculate the median, modes, variance, and standard deviations for the datasets but using the formulae for each arithmetic operation. To be confident that the mean obtained in each case was a true mean for the datasets, the standard error of the mean (SEM) was calculated. The statistic was computed by dividing the standard deviation by the square root of the sample size:
SEM =![]()
Therefore, the standard error of mean for the 3ml CO2/ 600ml water concentration would be:
SEM = 5,4046/√20
SEM = 1.2085
Thus, the standard errors of mean for our three datasets are 1.2085, 0.6856, and 1.0965, respectively. The data that does not vary a lot, for example, the data recorded for 6ml CO2 will have a smaller SEM implying that we are more confident that the mean calculated is a representation of the true mean of the data.
Table 2: Statistical Analysis of the Experimental Data
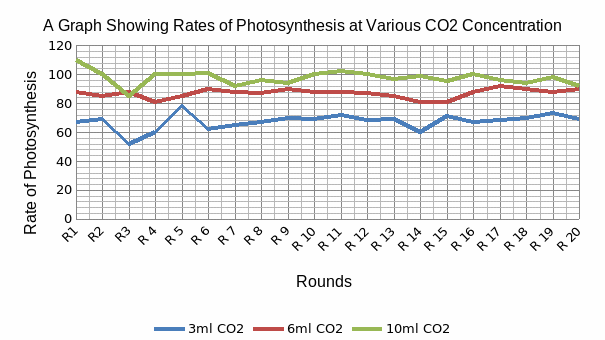
A table of the computed mean, median, mode, variance, standard deviation and the standard error of mean for the data obtained when the waterweed was subjected to varying concentration of carbon dioxide. A graphical representation of these data is given in figure 2 below.

This figure shows the comparison between numbers of bubbles of oxygen produced by the plant as a function of carbon dioxide concentration that the branch was subjected to. An important point to note is the high number of oxygen bubbles counted when the plant was supplied with 10ml CO2. The oxygen bubble numbers were highest in 10ml CO2, followed by 6ml CO2, and then 3ml CO2.
Discussion
The role of photosynthesis is to trap solar energy and introduce it into the ecosystem through the synthesis of carbohydrates and precursors of other biomolecules that are useful in the constitution of bodies of living organisms (Mauseth, 2008). The process of photosynthesis proceeds in two distinct phases. During the light reaction (photoreaction), light absorbed by the chlorophyll is used to hydrolyze the water molecules to yield hydrogen ions, oxygen, and free electrons.
The electrons move to the NADP+ to yield NADPH.
The light reactions are catalyzed by a series of enzymes and proteins that constitute the photosynthetic electron transport chain (ETC). The light dependent reaction can be summarized as shown below indicating the transfer of electrons from water to NADP+.
In addition to the products shown above, the electron transport chain activities/light reaction yields ATP. In summary, in photoreaction, electrons are removed from chlorophyll and may be reverted to chlorophyll via carriers (ETC proteins) with the assembly of ATP (cyclic photophosphorylation) or combined with hydrogen ions from the hydrolysis of water to form hydrogen atoms for the dark reaction (non-cyclic photophosphorylation) (Roberts & King, 2007). The hydrogen atoms are carried in the form of reduced NADP+ to the dark stage, a process involving electron transfer via chlorophyll photosystems I and II (Roberts & King, 2007).
The second phase of photosynthesis (carbon-fixation or synthesis reaction) utilizes ATP and NADPH from the photoreaction to convert carbon dioxide into the simple sugar glucose that is processed further to obtain sucrose and starch (Hames & Hooper, 2005).
The two molecules of glyceraldehyde 3 phosphate condense to form glucose, which then polymerize to form sucrose. Extensive polymerization yields starch. Glucose and other products of photosynthesis can be channeled to other biosynthetic pathways such as protein, lipid, nucleic acids, and lecithin biosynthesis. It may also be consumed by other organisms and be used in production of energy during respiration and in the manufacture of other biomacromolecules in these organisms.
Photosynthesis yields all the oxygen that organisms breathe in the atmosphere. Moreover, the power of the process has been a subject of scientific investigation for some time with researchers attempting to (1) utilize the photosynthetic organisms to produce pollution-free burning fuels like methane or hydrogen, and (2) develop simulated photosynthetic systems capable of sinking the CO2 content of fuels or polymers by capturing CO2 using nanotechnology (Mauseth, 2008).
From the above equations, it is evident that the rate of photosynthesis can be affected by other factors such as availability of water, light intensity, light color, and temperature in addition to CO2 concentration (Mauseth, 2008). However, in the present experiment, we were concerned with the effect of levels of CO2 on the rate of photosynthesis in waterweed. Therefore, other physical factors such as light intensity, the color of light, PH of the solution, and temperature had to be kept constant so as not to interfere with the inferences.
Biological variables which were either assumed or kept constant included leaf color (chlorophyll content in the branch), leaf size and age, stomata density and distribution, and the leaf variegation (Roberts & King, 2007). Variation in the method that were worth noting included how long the shoot remained viable for repeated experimental procedure, the size of the shoot, and the method of data collection. The choice of the water weed to use in the experiment is important. Though any aquatic plant, e.g., Elodea can be used, Cabomba, a tropical pondweed that can be obtained from aquatic shops is the best since it has a significantly higher rate of photosynthesis that can be monitored easily by observing the oxygen gas that is produced.
Evaluation
The results of the experiment agree with the assumption made at the start of the experiments, namely, the rate of photosynthesis increases with the increase in the levels of CO2. At any one given round of counting, the number of oxygen bubbles recorded was highest at 10ml CO2, followed by 6ml CO2, and lastly 3ml CO2. The average/mean counts of bubbles of oxygen produced at each CO2 concentration were 98, 87, and 67 for 10ml, 6ml, and 3ml CO2 concentrations, respectively. One can tell that the bubbles produced are oxygen by testing the gas.
In addition, because oxygen is the only gas produced during the light reaction of photosynthesis, it can be concluded that the bubbles emitted contained the gas. As water is hydrolyzed, oxygen is produced as a waste product. During the day when plants are actively photosynthesizing, much of the carbon dioxide produced during cellular respiration does not diffuse out of the plant body; instead, it is retained for use in photosynthesis. Therefore, the impact of CO2 from respiration on the experimental results was insignificant, or it was assumed so.
Based on the results, one can safely conclude that increasing the level of carbon (IV) oxide results in a concomitant increase in the rate of photosynthesis. The reasoning behind this conclusion is that CO2 is a reactant in the Calvin cycle to synthesize glucose. Therefore, its availability in high concentration means that dark stage of photosynthesis proceeds unhampered. There are no inhibitory feedback signals sent from the dark stage of the photoreaction, heralding the need for reduced rate of activity at the photoreaction.
The result is that the light dependent reaction proceeds at higher rate leading to high levels of O2 being produced as CO2 concentration availed to the plant increases, Hence, the CO2 level that resulted in the fastest rate of photosynthesis is 10ml/600ml water. At the start of the experiment, diverse bubble counts were made for each concentration of CO2. These scenarios are evident when one observes the shapes of the graphs above. The underlying explanation relate to the fact that at the start of the experiment, the branch was adjusting to the light intensity and temperature of the experimental setup.
From the graphs and the data, one can notice that with time the rate of photosynthesis at 10ml CO2 and 6ml CO2 almost equal each other. This may be because other than CO2, there are other factors that influence photosynthesis and may be the limiting factors responsible for the slowing rate of photosynthesis at the highest carbon dioxide concentration. Another possible explanation for this could be due to the counting errors made by the investigator.
Conclusion
Overall, photosynthesis, just like any other chemical reaction, is affected by the dynamics of its reactants and products. Increases in the concentration of reactants, CO2 included, results in a concomitant increase in the rate of photosynthesis until the optimum activity is reached whereby the reaction trails off because of the limitations of other factors. Similarly, accumulations of the products act as negative feedback mechanisms that slow down the rate of the reaction.
References
Hames, D., & Hooper, N. (2005). Photosynthesis. Bios Instant Notes Biochemistry. New York, USA: Taylor & Francis Group.
Mauseth, J. D. (2008). Photosynthesis. Botany: An Introduction to Plant Biology. Sudbury, Massachusetts: Jones And Bartlett Publishers.
Roberts, M. B. V., & King, T.J. (2007). Autotrophic Nutrition. Biology: A Functional Approach. Students’ Manual. Cambridge, UK: Thomas Nelson & Sons Publishers.