Introduction
The study generated findings from the data collected from participants (N = 325) who provided complete information in their questionnaires. Data analysis derived findings from raw information in the questionnaires by highlighting patterns and trends of information. Lacort (2014) asserts that descriptive statistics and inferential statistics are critical in data analysis for they provide valid and reliable findings. Descriptive statistics were used to evaluate the current state of travel agents in the online and high street business platforms. Essentially, descriptive statistics provide patterns and trends of demographic information and travel behaviour of participants.
Moreover, the study employed inferential statistics, namely, analysis of variance, Pearson’s correlation test, Chi-square test, and simple linear regression analysis, to establish the nature and strength of relationships within, between, and among demographic data and travel behaviours of participants. In line with the research objectives, these tests were used to evaluate the current state of high street travel agents, identify their strengths and weaknesses, and assess primary threats to their existence in the tourism industry in the United Kingdom.
As the study hypothesized that the presence of mobile applications and gender determine the number of times services were booked in the high street in the past year (2017), the study utilized analysis of variance. Regarding the hypothesis that preferred services associates with determinants such as age and the mode purchase, the study used the Chi-square test. Pearson’s correlation was used to test the hypothesis that salary has a positive relationship with age and the number of times services were booked in 2017.
Simple linear regression analysis was used test hypotheses that booking experience and technology are predictors of service quality, whereas annual net salary is a predictor of price consideration in both online and physical travel agents. Therefore, the study presented findings using tables and charts to demonstrate demographic characteristics and travel behaviours of participants in the tourism industry.
Demographic Information
The analysis of demographic information of participants reveals some patterns and drifts that are integral in interpreting and inferring findings. Gender, age group, and annual net salary of participants are the demographic variables that the study analysed.
Gender
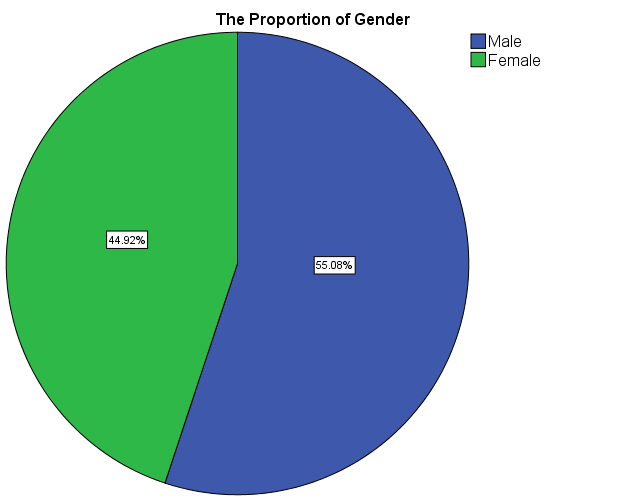
The distribution of gender (Figure 1) indicates that males form 55.08% (179), whereas females constitute 44.92% (146) of the total participants of the study.
Age Group
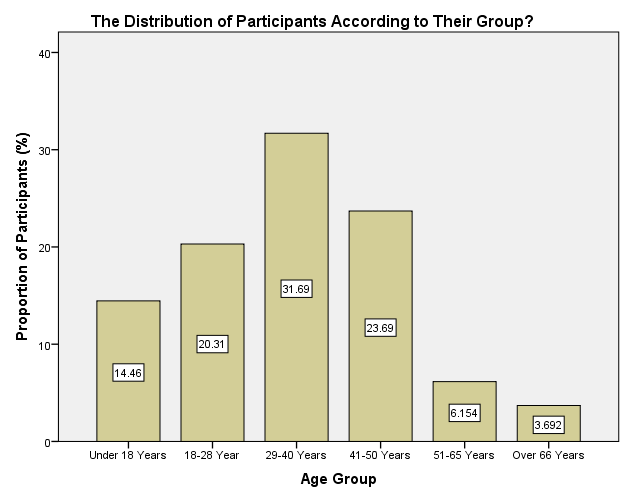
The analysis of the distribution (Figure 2) shows that most participants (31.69%) fall in the age group of 29-40 years. Approximately the same proportions of participants are in the age groups of 16-28 years (20.31%) and 41-50 years (23.69%). The proportion of participants under the age of 18 years formed 14.46%, while the proportion of those above 66 years is 3.69%. The participants in the age group of 51-65 years constituted 6.15%.
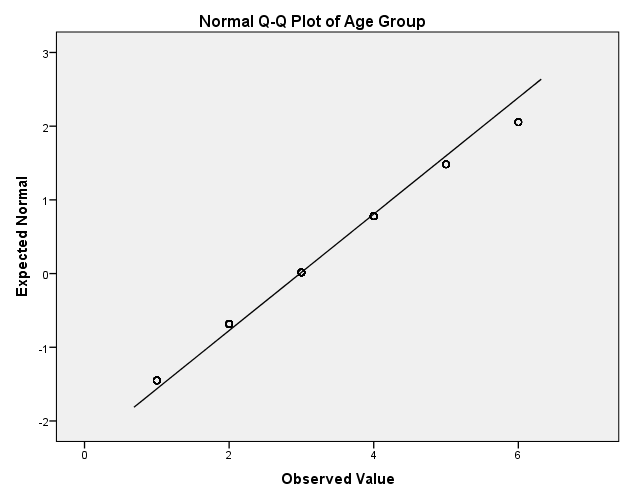
The analysis of normality using the Q-Q plot demonstrates that the distribution of participants according to their ages follows the normal distribution (Figure 3). The plot shows that the distribution of participants fits the population of study.
Annual Net Salary
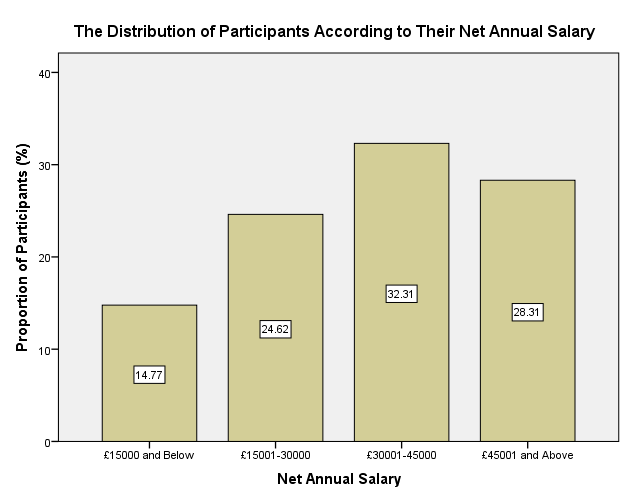
Figure 4 demonstrates that the participants earn different levels of salary annually. The majority of participants (32.31%) earns between £30001 and £45000 annual net salary. Additionally, the distribution indicates that 24.62% of participants earn between £15001 and £3000. Comparatively, while 14.77% of participants earn below £15001, 28.31% of them earn more than £45000.
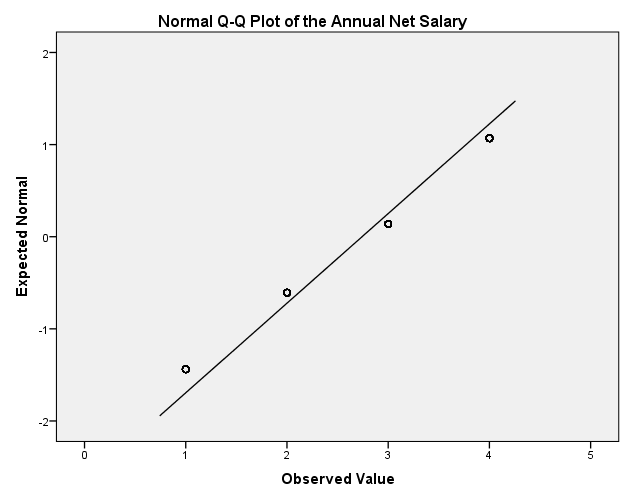
The test of normality using Q-Q plot illustrates that the distribution of participants according to their net annual salaries follows the normal distribution (Figure 5). In this view, the normality test shows that the distribution of participants fits the population.
Current State: Travel Behaviour and Booking Experience
The analysis of data shows that the participants have different travel behaviours and booking experiences. Since the objective of the study is to examine the current state of high street travel agents, the analysis of travel behaviours and booking experiences is necessary. In this view, the analysis focused on the booking experience, quality of services, technology, and price considerations among participants.
Booking Applications
Table 1 indicates that the majority of participants (74.5%) have booking applications in their mobile phones, while the minority of them (25.5%) does not have these applications. This distribution shows tourists and travellers have shifted from physical travel agents to online platforms in accessing booking services in the tourism industry.
Frequency of Bookings
The number of times the participants have booked services in the high street travel agents varied from one to more than seven times in 2017 (Table 2). About half of the participants (52.9%) made one-two times bookings in the high street travel agents. Frequency distribution shows that 17.8 %, 3.4%, and 2.2% of participants booked traveling services 3-4 times, 5-6 times, and 7 or more times. However, 23.7% of the participants stated that they did not book any services from the physical travel agents. What is apparent is that there are declining numbers of times the participants made bookings in the high street travel agents in the past year (2017).
Table 3 contrasts the frequency of physical bookings since the proportion of the number of times booked online in 2017 exhibit increasing trends. The majority of participants (45.8%) booked more than seven times through online platforms followed by 33.5% of those who booked for five-six times. Moreover, 16.3% and 4.3% of participants booked for services through online three-four times and one-two times respectively.
Preferred Services
The analysis of the preferred services shows variation in bookings done in the high street travel agents and online. Figure 6 depicts that most participants (44.92%) who book in the high street travel agents prefer hotels. Additionally, 22.15% and 13.54% of the participants prefer booking whole trip services and travel tickets in the high street travel agents respectively. A considerable proportion of participants (19.38) do not have preferential services in the high street travel agents.
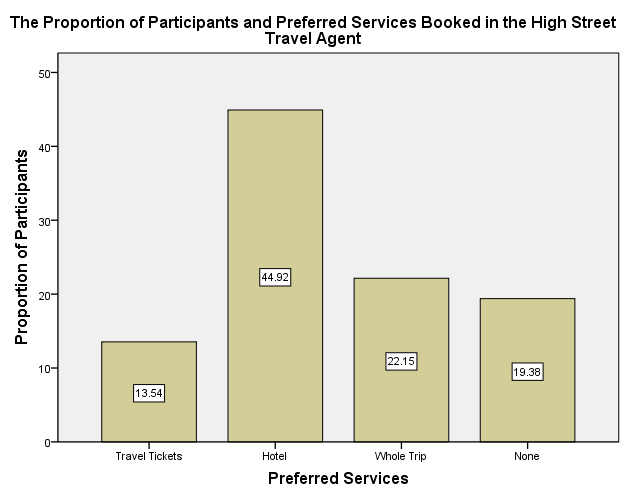
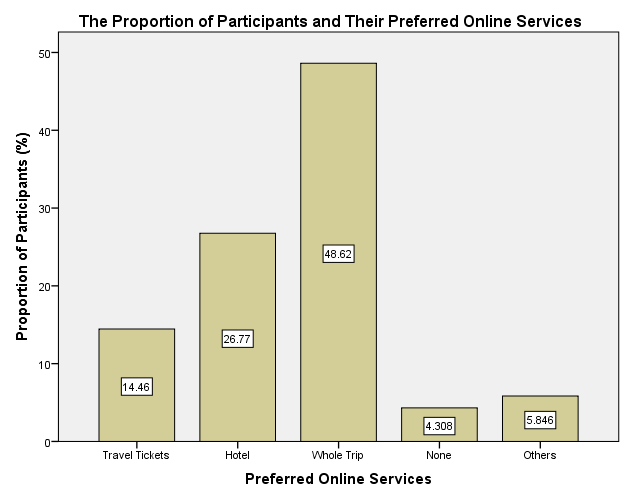
Figure 7 demonstrates that there is variation in the preferred services that participants make on the online platform. Most participants (48.62%) prefer whole trip services followed by 26.77% who prefer hotel services on the online platform. While 14.46% prefer tickets, 4.31% of them do not have preferences on the online services. Additionally, 5.85% of participants prefer booking other services using online travel agents.
Booking Experience
Table 4 below shows that the participants prefer online as the source of information on trips, consultations, and the mode of booking. Descriptive statistics show that participants agree (M = 3.90, SD = 0.944) that they obtain information about their travel destinations through online. However, the same participants disagree that they get information about their travel destination from high street travel agents (M = 1.88, SD = 0.728).
In the aspect of engaging in detailed consultations with travel agents, the participants showed different levels of engagements. The participants disagree (M = 1.90, SD = 0.702) that they engage their travel consultants in their physical offices, but they agree (M = 3.60, SD = 1.427) that they engross them in online platforms. Concerning booking mode, participants agree (M = 3.71, SD = 1.343) that they book their trips always through online, but they remain undecided (M = 2.10, SD = 0.943) that they book them via high street travel agents.
Quality of Service
Descriptive statistics (Table 5) depicts that the service quality of travel agents differ according to their mode of provision, that is, online and physical agents. The assessment of the quality of service shows participants strongly agree (M = 4.20, SD = 0.749) that online travel agents provide timely services, whereas they are undecided (M 2.19, SD = 1.076) that high street travel agents offer satisfactory services. Regarding the importance of information, participants agree (M = 3.69, SD = 1.276) that online travel agents are always helpful.
However, participants remain undecided (M = 2.19, SD = 1.076) concerning the importance of information they obtain from high street travel agents. During emergencies, the participants agree (M = 3.81, SD = 1.324) that the online travel agents offer timely and helpful rescue, while they remain neutral (M = 2.39, SD = 1.278) on the help they obtain from high street travel agents. The analysis of convenience of booking indicates that the participants agree (M = 3.56, SD = 1.333) that they can book a holiday from the online travel agents at any time, whereas they disagree (M = 1.94, SD = 1.138) that they can book from high street travel agents at any time.
Technology
The analysis of the role of technology in the tourism industry reveals that it has a significant influence on the booking experience and travel behaviour of tourists (Huang, Goo & Yoo 2017). The participants agree (M =3.5, SD = 1.360) that the booking applications on their mobile phones are very convenient to use (Table 6). Moreover, the participants strongly agree (M = 4.30, SD = 0.639) that they trust online payment system in the websites of travel agents (Table 6). When choosing a holiday destination, the participants agree (M = 3.41, SD = 1.499) that they consider the online feedback of customers. Therefore, the participants agree that technology plays a central role in making reservations, paying for services, and choosing travel destinations
Price Considerations
Since the price has a marked impact on the purchasing behaviours of customers (Amaro & Duarte 2015), comparison of considerations of customers in high street travel agents and online travel agents is essential. The participants agree (M = 3.71, SD = 1.265) that the price of undertaking online bookings is lower than that of high street travel agents (Table 7). Additionally, the participants agree (M = 3.40, SD = 1.120) that price is the only factor that would make them procure services on the online platform. The participants disagree (M = 1.80, SD = 1.120) that a slightly more expensive price on the high street would not discourage them (Table 7). Regarding the preference of high street travel agents, the participants remain undecided (M = 2.40, SD = 1.281) that price would influence them.
Important Relationships between Demographic Variables
The Number of Times Booked in 2017 and Mobile Applications
The analysis of variance was used to test the hypothesis that the presence of applications in mobile phones encourages customers to purchase services online frequently. To determine if presence of mobile applications determines the number of times services were booked in high street in the past year (2017), the study utilized analysis of variance. Since presence of mobile applications in phones is a categorical variable and the number of times services were booked is a continuous variable, the appropriate test is analysis of variance. Comparison of the number of times booked in 2017 and the use of mobile applications exhibited variation in online and physical travel agents.
Table 8 indicates that the number of times booked in the high street travel agents is almost the same for participants with (M = 2.03, SD = 0.868) and without (M = 2.19, SD = 0.833) mobile applications. Concerning services booked from online travel agents, participants with mobile applications (M = 4.11, SD = 0.971) depicted a higher number of times than those without mobile applications (M = 3.59, SD = 1.22).
Table 8. Descriptive Statistics of the Number of Times Booked versus Mobile Applications.
Table 9 shows that there is no significant difference between the number of times the participants with and without mobile application booked services from high street travel agents in 2017(F(1, 323) = 2.134, p = 0.145). However, there is a significant difference in the number of times participants with and without mobile applications booked services from online travel agents. These findings demonstrate that the presence of applications in mobile phones encourages online booking of services (Baldwin 2016).
Gender and the Number of Times Booked in 2017
The analysis of variance was used to test the hypothesis that gender determines the number of times services that were booked in high street in the past year (2017). This analysis is relevant because gender (the independent variable) comprises of two categories and the number of times were booked (the dependent variable) is on a continuous scale. Table 10 shows that the number times the participants booked services from the high street travel agents is higher for females (M = 2.28, SD = 0.803) than males (M = 1.91, SD = 0.872). In contrast, the number of times the participants booked services from the online travel agents is higher for males (M = 4.29, SD = 1.05) than females (M = 3.88, SD = 0.810).
Table 10. Descriptive Statistics of Gendered Number of Times Booked in 2017.
The analysis of variance (Table 11) shows that the number of times male participants booked services through high street travel agents is statistically significantly lower than that of female participants, F(1,323) = 16.026, p = 0.000. In contrast, the number of times female participants booked services via online agents is statistically significantly lower than that of male participants, F(1,323) = 14.734, p = 0.000.
Preferred Services and Platform
To test the hypothesis that a business platform associates with the nature of preferred services, the study utilized Chi-square test. Since preferred services (travel tickets, hotel, whole trip, and others) and the platform of business (online and street) exist on categorical scale, Chi-square test is appropriate in determining their associations. Cross-tabulation (Table 12) indicates that there is an association between preferred services booked in the online and high street travel agents. The participants indicated that they (146) prefer to book hotel services (44.9%) via the high street travel agents and 158 of them (48.61%) prefer to book whole trip services through the online travel agents. Comparatively, the preference for travel tickets and other services do not exhibit significant variations.
Chi-square test (Table 13) demonstrates that there is a significant association between preferred services and the mode of booking them through online and high street travel agents, χ(12) = 28.721, p = 0.004. In this case, it is valid to claim that participants prefer booking whole trips through online travel agents and hotels via high street travel agents.
Number of Times Booked and Annual Net Salary
Pearson’s correlation was used to test the hypothesis that age and the number of times services were booked have positive relationship. Essentially, this test is suitable because age and the number of times services are on continuous scale and exhibit linear relationships. Table 14 depicts that there is a moderate positive relationship, which is statistically significant (r = 0.451, p = 0.041), between the number of times the participants booked services from online travel agents and the annual net salary.
Furthermore, correlation shows that annual net salary has a weak positive relationship, which is statistically significant (r = 0.206, p = 0.000), with the number of times the participants booked services from high street travel agents. These relationships imply that customers with higher levels of salary tend to prefer online bookings than those with lower levels of salary.
Age Group and Annual Net Salary
Furthermore, correlation analysis was used to test the hypothesis that age group and salary have positive relationship. Given that that age group and salary have continuous scales and depict linear relationship, the study employed Pearson’s correlation to assess their relationships. Correlation analysis (Table 15) indicate that there is a statistically significant positive relationship between age and annual net salary that the participants earn (r = 0.717, p = 0.000). Since the number of services booked in the past year increased with the annual net salary, it implies that the target customers in the tourism industry are adults and old individuals.
Patterns and Trends of Travel Behaviours and Experience
Since the study sought to test the hypothesis that booking experience has statistically significant influence on the service quality, it used simple linear regression analysis. Additionally, the study used simple linear regression analysis to test the hypothesis that annual net salary has significant influence on price consideration among participants. Simple linear regression analysis is appropriate because it measures the strength and the degree of the influence of an independent variable on a dependent variable. In this case, simple linear regression analysis was used to test the hypotheses that booking experience
Booking Experience and Service Quality of High Street Travel Agents
Simple linear regression model (Table 16) shows that the booking experience in high street travel agents has a weak relationship with service quality (R = 0.267). In this case, booking experience explains 7.1% of the variation in the service quality (R = 0.071).
The regression model (Table 17) is statistically significant in explaining the influence of booking experience on the quality of services that customers get in the high street travel agents, F(1,323) = 24.868, p = 0.000. This finding means that simple linear regression model effectively predicts the effect of booking experience on the quality of services that customers get in the tourism industry.
Coefficients of regression (Table 18) shows that the booking experience of high street travel agents is a statistically significant predictor of the quality of service (β = 0.209, p = 0.000). Essentially, the regression coefficients means that a unit increase in booking experience causes the service quality to increase by 0.21 units of the Likert scale used. Regression equation made from these coefficients in that:
Service quality = 0.209 (Booking experience by high street travel agents) + 3.03
Booking Experience and Service Quality of the Online Travel Agents
The regression analysis (Table 19) indicates that the booking experience has a strong positive relationship with the service quality obtained from the online travel agents (R = 0.649). Booking experience accounts for 42.1% of the variation in the service quality provided by online travel agents.
The regression model (Table 20) is statistically significant in predicting the influence of booking experience on the quality of services that customers get from online travel agents, F(1,323) = 234.452, p = 0.000. This finding implies that the simple linear regression model is valid in assessing the effect of booking experience on the quality of services.
Table 21 illustrates that booking experience is a statistically significant predictor of service quality offered by online travel agents (β = 0.508, p = 0.000). The coefficients mean that a unit increase in booking experience causes the quality of service to increase by 0.51 units of the Likert scale. Thus, the findings imply that booking experience determines the quality of services that customers get in the tourism industry. In this case, the regression equation is that:
Service quality = 0.508 (Booking experience by online travel agents) + 1.259
Technology and Service Quality by the Online Travel Agents
As technology has revolutionised the mode of service delivery in the tourism industry (Kim & Kim 2017), an examination of its relationship with the quality of service is critical. Regression analysis (Table 22) indicates that there is a moderate positive relationship between technology and the quality of service travel agents deliver online (R = 0.535). Moreover, technology explains 28.7% of the variation in the level of service quality offered by online travel agents (R2 = 0.287).
The regression model (Table 23) applied to the prediction of the service quality by the technology is statistically significant (F(1,232) = 129.753, p = 0.000). The significance of predictor means that travel agencies can use technology in improving the quality of their services in the tourism industry.
Table 24 illustrates that technology is a statistically significant positive predictor of the service quality (β = 0.420, p = 0.000). In this view, the regression coefficients mean that when technology increases by a unit, the level of service quality increases by 0.42 units of the Likert scale. The regression equation of this model is that:
Service quality = 0.42 (Technology) + 1.662
Annual Net Salary and Price Consideration
Based on the annual net salary, it is apparent that participants have different economic conditions. Regression analysis (Table 25) indicates that there is a weak relationship between the annual net salary and the consideration of price in booking services from travel agents in both online and high street agents (R = 0.219). R-square (0.048) shows that the annual net salary explains 4.8% of the variation in price consideration among the participants.
Table 26 demonstrates that the regression model is statistically significant in predicting the effect of the annual net salary on the perception of price as a factor of considering booking preference among participants, F(1,323) = 16.275, p = 0.000. This model means that linear regression analysis accurately predicts price consideration based on the annual net salary of customers.
Coefficients of regression analysis (Table 27) shows that the annual net salary is a statistically significant negative predictor of price consideration among participants (β = -0.27, p = 0.000). The coefficients imply that a unit increase in the annual net salary causes the price consideration among participants to decline by 0.27 units of the Likert scale employed in the study. These coefficients also show that the regression equation is that:-
Price consideration = -0.27 (Annual net salary) + 4.45
Summary
The analysis of the data revealed main findings that travel agents need to consider in their operations to remain relevant and competitive in the United Kingdom (Table 28). Demographic trends show that most of the people have mobile applications, use online platforms in booking services from the travel agents, and register a high frequency of bookings. While hotels form a preferred service in the high street travel agents, whole trips are common among online travel agents. Booking experiences and travel behaviours show that most customers prefer online travel agents because they are cheap, trustworthy, convenient, and offer satisfactory services (Agag & El-Masry 2016). Additionally, the regression analysis shows that booking experience, salary, technology, and price are statistically significant predictors of the quality of services among online travel agents.
Reference List
Agag, GM & El-Masry, A 2016, ‘Why do consumers trust online travel websites? Drivers and outcomes of consumer trust toward online travel websites’, Journal of Travel Research, vol. 56, no. 3, pp. 1-23.
Amaro, S & Duarte, P 2015, ‘An integrative model of consumers’ intentions to purchase travel online’, Tourism Management, vol. 46, no.1, pp. 64-79.
Baldwin, R 2016, The great convergence: information technology and the new globalisation, Harvard University Press, Cambridge.
Huang, CD, Goo, J & Yoo, CW 2017, ‘Smart tourism technologies in travel planning: the role of exploration and exploitation’, Information & Management, vol. 54, no. 6, pp. 757-770.
Kim, D & Kim, S 2017, ‘The role of mobile technology in tourism: patents, articles, news, and mobile tour app reviews’, Sustainability, vol. 9, no. 1, pp. 1-45.
Lacort, MO 2014, Descriptive and inferential statistics: summaries of theory and exercises solved, Lulu Press, Morrisville, NC.