Financial Markets
Five-Year Performance of Domestic Economy
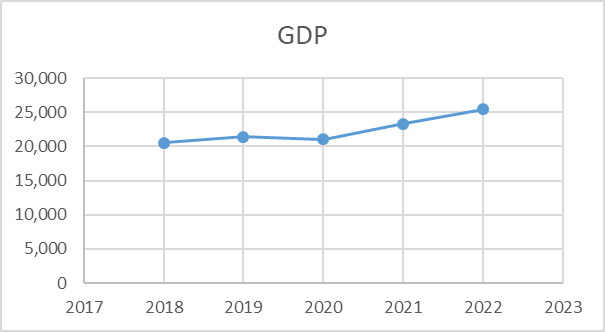
The domestic economy can be evaluated using a wide variety of metrics. One of the most common metrics for evaluating an economy’s performance is Gross Domestic Product (GDP). According to Macrotrends (2023a), the US GDP has been growing steadily for the past five years, from $20,533 billion in 2018 to $25,460 billion in 2022, as demonstrated in Figure 1 below.

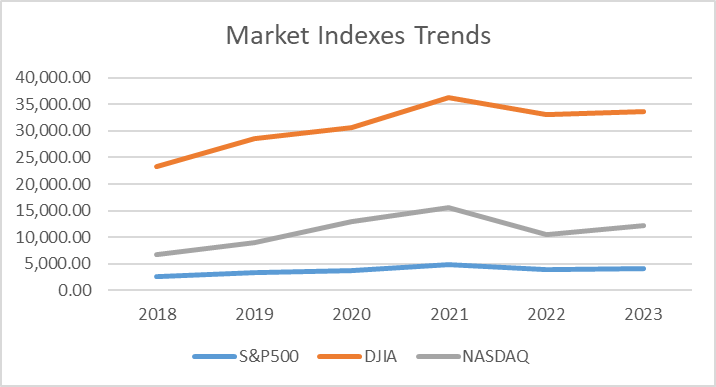
However, the indexes of the US market, including S&P500, NASDAQ, and Dow Jones, demonstrated a significant decline in 2022 compared to previous years, as shown in Figure 2 below. The analysis of indexes against GDP growth revealed that GDP changes could not explain the fluctuations in market indexes, as, despite the GDP growth, all three market indexes decreased. According to Pound and Subin (2022), the fall of the stock market can be explained by external reasons, including the war in Ukraine and the situation with COVID-19 in China.

Market Performance Data Explanations Using Asset Valuation and Macroeconomics
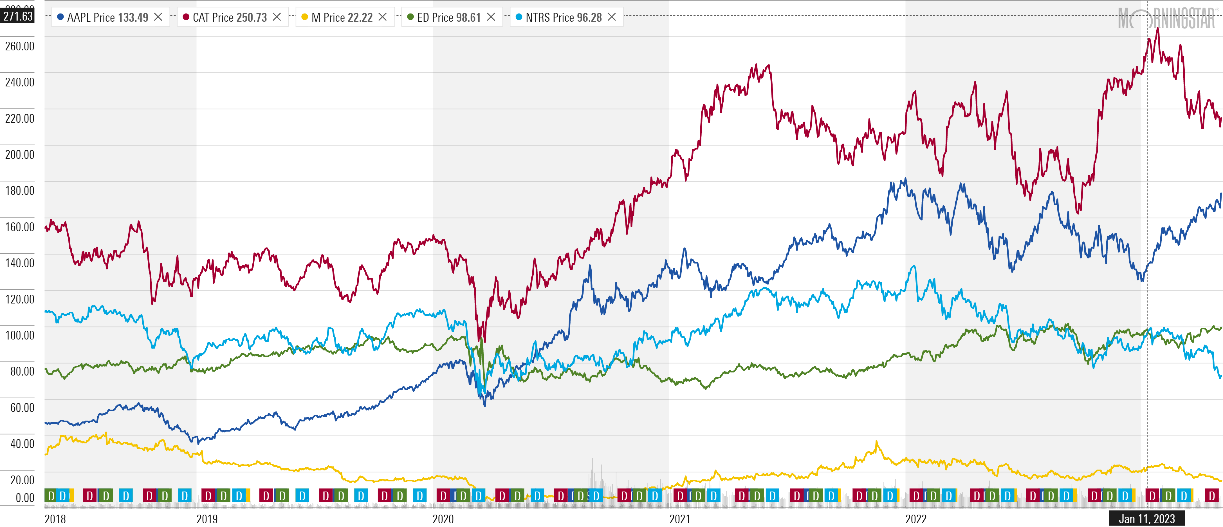
Apple’s stock prices are currently after a significant fall in Q3 and Q4 of 2022 from $173 per share to $124 per share at the end of the year (Morning Star, 2023a). The fall at the end of the year was associated with a significant decline in the company’s income growth speed. In 2021, the company experienced almost a 65% increase in net income compared to 2020, while the net profit growth in 2022 was only slightly above 5%, negatively affecting EPS and P/E growth (Morning Star, 2023a). However, the overall rise of the stock markets in 2023 positively impacted Apple’s stock, allowing Apple to regain its value (Morning Star, 2023a). Currently, Apple’s stocks are traded at around $174 per share.
Caterpillar’s stock is trading at $214 per share after falling from $260 per share at the start of the year (Morning Star, 2023b). One of the primary reasons for the decline in share prices is the company’s decreased margins in 2022 due to growing costs associated with high inflation. Previously, the company’s stocks were increasing, unlike the overall trends in the financial indexes, which was explained by the growth in the company’s sales. However, a significant rise in share prices led to decreased EPS and P/E ratios, which made the stock overvalued (Morning Star, 2023b). As a result, the company’s stocks started to fall at the beginning of 2023.
Consolidated Edison’s stock is currently trading at $100 per share, similar to the same period in 2022 (Morning Star, 2023c). Even though the company experienced a significant decrease in share prices in October 2023, which was dictated by the macroeconomic trend, the company demonstrated stable growth in terms of EPS from $3.85 in 2021 to $4.66 in 2022, which allowed the company to return to its position of the previous year (Morning Star, 2023c).
Northern Trust is trading at $74 per share, demonstrating a steady negative growth since January 2022 (Morning Star, 2023d). The central reason for that is the decrease in share prices, which is the unfavorable performance of the company in terms of profitability. Northern Trust’s EPS decreased from $7.13 in 2021 to $6.14 in 2022, which led to a decreased trust of investors (Morning Star, 2023d). Recent macrocosmic trends positively affecting stock prices had no notable influence on Northern Trust’s share price (Morning Star, 2023d).
Macy’s stock price is currently trading at around $15 per share, which has steadily declined since November 2021 (Morning Star, 2023e). After a fast recovery in 2021 after the COVID-19 pandemic’s effect, the company’s growth slowed down, leading to a decrease in share prices. Macy reports that the central reason for the share price loss is the inflation increase that pressures consumers (Escobar, 2023). The trends of the share prices are provided in Figure 3.

Companies’ Valuation
Key Ratios
Using ratios for company valuations is beneficial. Ratios provide a standardized method for comparing a company’s financial performance to those in the same industry or sector. This helps to provide context for the company’s financial standing and allows for a more meaningful comparison of economic performance. The key ratios of the company are provided in Table 1 below:
Table 1. Key financial ratios.
In 2022, significantly overextended financially, having a debt-to-equity ratio of 1.953 compared to the industry average of 0.06. However, Apple’s liquidity was high, with an interest coverage ratio (EBITDA/Interest) of 38.27 and an industry average of 28.35. Caterpillar was also highly overleveraged; its D/E ratio is 1.953 with an industry average of 0.73. At the same time, Caterpillar demonstrated strong liquidity with an interest coverage ratio of 25.765 compared to the industry average of 19.48.
Consolidated Edison demonstrated a higher level of long-term solvency with a D/E of 0.987, while the industry average was 1.35. However, the company’s liquidity suffered, with a Debt/EBITDA ratio of 4.384 and an industry average of 7.18. Northern Trust demonstrated a solid position in terms of leverage with a balanced D/E ratio of 1.1. Finally, Macy’s was significantly overleveraged (D/E = 1.46) compared to the industry of 0.7. However, the company’s interest coverage ratio was very high (150.12), while the industry average was 9.36, demonstrating strong liquidity performance.
Company Valuations
The companies were evaluated using Net Asset Value (NAT) and price-to-earnings (P/E) multiples. The results are provided in Table 2 below.
Table 2. Asset valuation.
The analysis demonstrated that Apple was the most overvalued company among the five, with an NAV of $3.1 at a share price of around $174 and a P/E ratio of 29.41. At the same time, Macy’s was the least overvalued stock, with an NAV ($14.51) close to the current share price of $14.87 and a P/E ratio of 3.6.
Key Stakeholders
Publicly traded companies have various stakeholders, including shareholders, customers, employees, suppliers, regulators, and communities, who are directly or indirectly interested in the company and its performance. Shareholders expect the company to generate profits and increase the value of their investments (Quiry et al., 2022). Customers expect the company to provide high-quality products or services at a reasonable price (Quiry et al., 2022). Employees expect fair pay and benefits, opportunities for career growth, and a safe work environment (Quiry et al., 2022).
Suppliers expect the company to maintain financial stability and pay its bills on time (Quiry et al., 2022). Regulators expect the company to comply with laws and regulations. In contrast, communities expect the company to be a good corporate citizen by creating jobs, supporting local charities, and minimizing its environmental impact (Quiry et al., 2022). Ultimately, all stakeholders expect the company to operate responsibly and ethically while generating sustainable value over the long term.
References
Escobar, S. (2023). Macy’s Warns Consumers Will Be Pressured in 2023. Retail Shares Are Slipping. Barron’s. Web.
Macrotrends. (2023a). U.S. GDP 1960-2023. Web.
Macrotrends. (2023b). NASDAQ Composite Index. Web.
Macrotrends. (2023c). S&P 500 Historical Annual Returns. Web.
Macrotrends. (2023d). Dow Jones – 10 Year Daily Chart. Web.
Morning Star. (2023a). Apple Inc. Web.
Morning Star. (2023b). Caterpillar Inc. Web.
Morning Star. (2023c). Consolidated Edison Inc. Web.
Morning Star. (2023d). Northern Trust Inc. Web.
Morning Star. (2023e). Macy’s Inc. Web.
Pound, J., & Subin, S. (2022). Stocks fall to end Wall Street’s worst year since 2008, S&P 500 finishes 2022 down nearly 20%. CNBC. Web.
Quiry, P., Le Fur, Y., & Vernimmen, P. (2022) Corporate Finance: Theory and Practice. Wiley.