Introduction
Substantial quantities of clinical data characterize the healthcare field. Therefore, frequency distributions emerge as a viable option for data in summarizing data, as it is challenging to analyze them in raw forms.
Uses of a Frequency Distribution
A frequency distribution is used to describe two types of measures. These include the measures of variability and central tendency (Daniel & Cross, 2018). The frequency distribution is used in a variety of situations in the hospital setting.
Inpatient Census
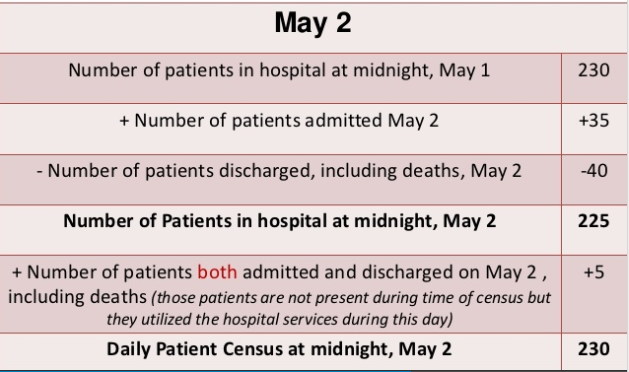
Inpatient census is defined as the proportion of inpatients present in the hospital at a given time (Daniel & Cross, 2018). Most hospitals conduct an official count of patients at midnight since the census varies during the day as admissions and discharges take place. This count is known as the Daily Inpatient Census. The Daily Inpatient Census comprises any patient admitted and discharged on the given day.

Length of Stay
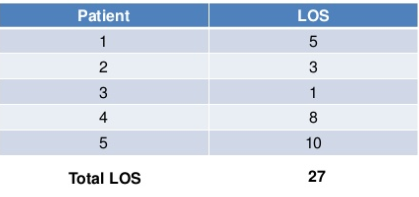
Length of stay (LOS) is usually computed after a patient is discharged. It is described as the number of days from the day of admission to the day of discharge (Daniel & Cross, 2018). However, the day of discharge is excluded. Total LOS is obtained by summing up the LOS of all patients discharged or who died over a given duration.

Safety-Related Measures
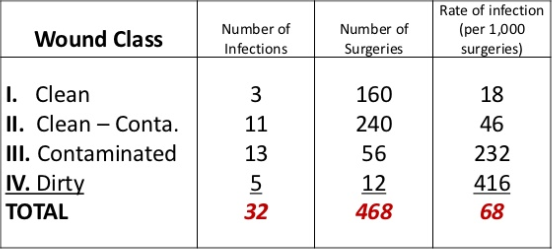
The use of frequency distribution allows for the evaluation of safety-related measures such as risk stratification and subgroup analysis (Daniel & Cross, 2018). For instance, risk stratification constitutes classifying the population at risk based on a common variable, for example, wound class.

Normal, Positive, and Negative Skews
A normal skew is a phenomenon where a frequency distribution idealizes a normal “bell” curve. On the other hand, a positive skew occurs when the frequency distribution stretches out to the right. Lastly, a negative skew when the frequency distribution stretches out to the left.
Relationship Between Skewness and Standard Error
The ratio of the standard error to skewness is used as a test of normality. The normality can be disregarded when the ratio is either less than -2 or greater than +2 (IBM, 2019). For instance, an extremely negative value suggests a long left tail, while a large positive value for skewness suggests vice versa.
References
- Daniel, W. & Cross, L. (2018). Biostatistics: A foundation for analysis in health sciences. New York, NY: John Wiley & Sons.
- IBM. (2019). Display statistics. Web.