Marketing
An analysis of the marketing setup is provided in this section. Various indicators for the Verizon market forces are discussed. The following Exhibits provide details of the company’s market and share.
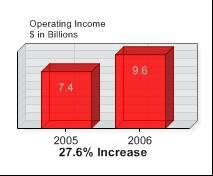
Exhibit 1: Trend Analysis of Measures for Marketing Performance.
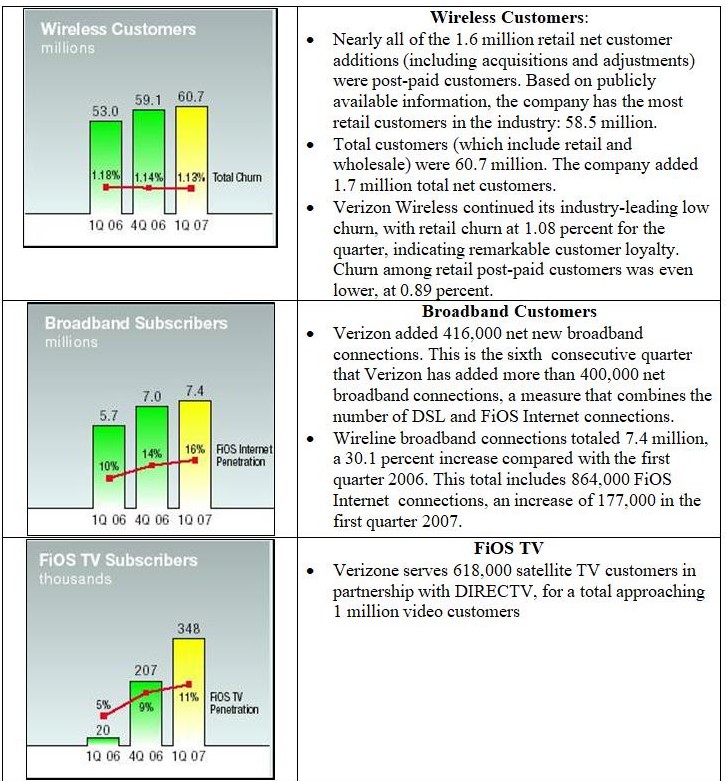
Exhibit 2: Comparative Analysis of Measures for Marketing Performance.
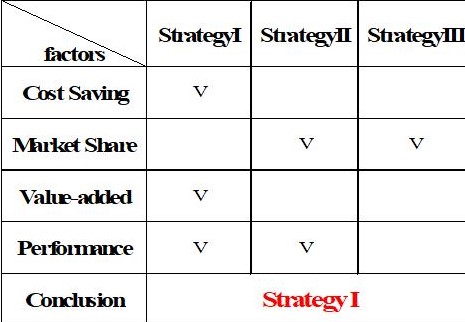
Exhibit 3: Findings of Verizone Marketing Performance.
The next sections provide the research to support the findings.
Market share
According to a report by Merryl Lynch, Verizone has projected higher growth rates and the market share is increasing. The following table provides the market share of Verizone wireless when compared to the competitors for a 3 year period.
Table 1: Market Share of Verizone (Merrill Lynch, 2007).
Market segments
Verizone operates in two-core businesses Wireline and Wireless and these are operated as separate strategic business units (Business Segments 29 June 2007).
Wireline – Verizon Telecom: This segment provides services such as local telephone services, broadband services, nationwide long-distance services, etc. These services are provided for small and medium businesses as well as consumers.
The figures for this segment are shown in Table 2.
Table 2: Market Segment Wireline Verizone Telecom – Operating Revenue.

As can be seen in the table and the graph, the revenues for this segment have increased from 31,694 to 32,938 USD billion.
Wireline – Verizon Business: These are advanced communication systems and solutions and cover areas such as security, hosting, networking, mobility, IT solutions, etc. Target customers are large business and governmental bodies across the globe.
Table 2: Market Segment Wireline Verizone Business – Operating Revenue.
As can be seen in the table, the revenues for this segment have increased from 7,771 to 20,678 USD billion
Domestic Wireless: This segment provides products such as wireless voice and data services and the customers are wireless networks across the world.
Table 3: Market Segment Domestic Wireless – Operating Revenue.
As can be seen in the table and the graph, the revenues for this segment have increased from 32,301 to 38,043 USD billion
Type of customers
Verizone has a blend of customers from different groups. The customers can be broadly classified as Residential, Small Business, Medium Business, Large Business, and Wireless. The customer addition information is given in the following table for both Wireless and Wireline segments.
Table 4. Customer Performance Figures (Quarterly Bulletin June 2007).
Figures for individual segments are illustrated in the following graphs.

Brand awareness
Rogers (Rogers 2007) has conducted a study among teenagers and other user groups in US. The study reports that about half of the teenagers and Tweens in US are using Verizon for providing their services. The value of this market segment is estimated at USD 10.7 billion. The study has reported that the brand awareness was 46% and the market share among this group was 30%. The figures for different brands and their awareness is given in the following table.
Table 6. Brand awareness among Teens and Tweens in the US.
According to Robert: “Kids, Teens and Tweens are the major consumers and 53% of kids play games on their phones, with more than a third downloading new games… 52% use their phone’s calendar/organizer option… and nearly all teens who have camera phones are snapping pictures. In addition, the overwhelming majority of teen and tween cell phone owners — 89% — have used or changed their ring tones, to add a personal touch to their cells.”
Customer satisfaction
According to a survey done by the JD Power and Associates 2006 Business Wireless Satisfaction Study (Power 2006), Verizone ranks the highest among service providers in US. The study surveyed 2725 businesses and has concluded that business ranked Verizone higher than other providers in the customer satisfaction survey. Parameters such as call quality, reliability, brand image and performance were used.
Customer loyalty
Customer loyalty is measurer by the Churn percentage, which is the number of existing customers who move out to other service providers. As shown in Table 1, the Churn percentage for Verizone is the lowest among its competitors and the figures are about 1.5%. The other companies have a relatively higher percentage, of more than 3.5 %.
Promotional effectiveness
Verizone has used a number of media to build its brand and enhance the image of the product. It uses online Ads, Print Ads, TV spots and many other types of media to boosts its image and make the brand more popular. They have also roped in celebrities and pop artists such as Christina Aguilera, Shaquille O’Neil and Kid Rock (Verizon Commercials 3 February 2005). The commercials and advertisements have helped in increasing the brand awareness of Verizon.
Distribution channel utilization
Reports from the media suggest that in spite of having a robust distribution channel. The company has initiated a number of plans such as the Verizon Solutions Provider Program and the Verizon Referral Program. These are designed to enhance the distribution channels of the company and increase the sales and revenue growth.
Competitive Analysis
This section provides the competitive analysis of the industry as per various indicators.
Dominant Economic Characteristics
The Telecommunication industry is expected to be worth about 500 billion USD by 2010. The industry is highly technology driven and customers demand better quality of service, reduced rates and increased bandwidth. With the increase in hand held devices, cellular phones, iPhones and other personal communication devices, customers are demanding a better service of quality. The networks should have the ability to allow customers to download and exchange rich multimedia applications, movies, music, videos and so on.
The small and medium businesses are demanding enhanced connectivity that would allow their employees to communicate easily. The big business are increasing their demand for massive bandwidth that would allow seamless integration of their back offices to various data warehouses and data centers. There are a number of competitors in the market and the major ones are Cingular, Nextel, SprintPCS and T-Mobile. These companies are adopting a strategy of enhancing their technological base and increasing their dominance in niche markets.
Companies such as AT&T have a large base and a sound experience in handling the market but their share in specific segments has fallen. With the rise in off shoring, it is very important for the companies to have a global presence in the developing countries of Asia and Latin America (Merrill Lynch 2007).
Driving Forces in the Industry
The driving forces in the industry are the technological upgrades and changes, the ever increasing need for greater bandwidth and the ability to have a viable presence in small towns. Companies such as Verizone have actively started marketing their service in such places by developing an extensive network of dealers and distributors. Another driving force is the ability to integrate well with other networks and adopt a revenue sharing mechanism that benefits the affected carriers.
Strategic Moves of the Rivals
The rivals or competitors are not only bringing in new technology and new service offerings. Verizone has tied up with YouTube to allows download of videos and movies through high speed connection. It has also tied up with iPhone and Apple to provide download of music and videos on demand. It would be difficult for companies to survive and grow on their own so they are taking the route of organic acquisitions.
Key Success Factors of The Industry
There are certain key success factors in the industry and they are:
- Providing extensive coverage umbrella to ensure that all possible areas are connected
- Using the best in technology and services to provide high bandwidth connectivity to the users
- Ensure that the technology upgrade costs are not passed on directly to the customers as this is a price sensitive market and any perceived price hikes would see more Churning.
Company’s Weighted Competitive Strength Assessment
This section provides the weighted competitive strength assessment of Verizone. Table 7. provides the competitive strength assessment of Verizone as compared to two of its competitors (Thomson 2004).
Table 7. Weighted Competitive Strength Assessment of Verizone and competitors (with inputs from Power J.D. (18 May 2006)).
Note: Rating Scale: 1 = Very Weak; 1o = Very Strong.
The above table shows the performance of Verizone and its competitors by using the analysis done by Powers JD. Quantitative strength ratings for industry key success factors and each competitively pivotal resource capability have been considered. The study was done with Verizone has a weighted strength of 7,15 and is the leading brand when compared to the other rivals.
Evaluation
The following strategies have been recommended in the study.
- Strategy I – Providing Outstanding Performance and Services Based on Present Technologies.
- Strategy II – Developing New Advanced Technologies
- Strategy III – Expanding Foreign Markets
The following chart shows the comparison of the four strategies.

Strategy I is recommended and the following tests are performed to verify the recommendation. The test results are based on the Weighted Competitive given in Table 7.
- Compatibility Test: The score for Verizone for the measure ‘Quality/ Product Performance’ is 0.08 and for the rivals, it is 0.06 and 0.04. This means that the company is already perceived as a provider of quality product with good performance. Implementing the strategy means that the market leadership would be maintained. Hence the strategy has passed the compatibility test.
- Consistency Test: As seen for different measures such as technological skills, relative cost position and customer service capabilities, Verizone is placed in the mid or higher range. Hence the strategy has passed the consistency test and it must be implemented.
- Feasibility Test: The indicators for Financial resources and manufacturing capability are on the lower side when compared to the other competitors. Additional financial resources needs to be in place before the strategy is implemented. But the strategy must be implemented hence the strategy has passed the test.
- Competitive Advantage Test: All the indicators and previous analysis done show the importance of providing high quality services. In fact, providing such services is a key requirement for getting competitive advantage and retaining customer loyalty and ensuring a low churn. Hence the strategy has passed the test.
References
Business Segments (2007). ‘Business Segments of Verizone’.
Merrill Lynch (2007). ‘Verizon Wireless gaining market share‘. Web.
Power J.D. (2006). ‘Verizon Wireless Ranks Highest in Business Wireless Customer Satisfaction Index’.
Quarterly Bulletin (2007). Investor Quarterly 2007.
Rogers Ben (2007). ‘Verizon Wireless News’.
Thomson, A., & Strickland, A. (2004). Crafting and Executing Strategy: Text & Readings, 15th Edition, McGraw-Hill/, Irwin, New York
Verizon Commercials (2005). ‘Verizon – Get Little’. Web.