Introduction
Three results played a central role in defining and shaping decision-making. These formed the evaluation measures. The Monte Carlo method was also opted for simulation analysis.
Net Present Value
The net value is considered as the present amount of the project’s costs deducted from the current value of inflow cash and this difference is the amount due from the project to the shareholders. As the Net Present Value increases the higher, the quantity contributed by the project appreciates therefore increasing the value of the stock’s price. The Net Present Value is the commonly preferred criteria for the single screening exercise. Projects considered under net present value options fall either in the short-term or long-term categories. Short-term projects occur when the cash inflows are made relatively sooner. On the other hand, long-term projects consist of more cash inflow than their short-term counterpart does. However, it is possible in the later years of the projects. In the discounted cash flow analysis, the focal approach is the net present value. In addition, it takes the structure of a time value for cash appraisal utility. This is especially true in the case of long-term projects. The net present value has found its way in the capital budgeting sector. In other related fields, it is useful to measure underperformance or surplus in the cash flows in the current value terms in order to meet the charges for finances.
Internal Rate of Return
Internal Rate of Return is a unique approach in the application of discount rates. This is because when applied it generates a non-discounted model with zero net present value for either inflow or outflow cash for investment’s economic life. This means there is a breakeven of cash flow such that an exact neutral balance of the incoming and outgoing cash flows influences the investment. In this case, the principal of investment is recoverable given a period of economic life. This period is specific and the incoming cash flow makes equal returns based on the discount rate given. There are three conditions of internal rate of return similarly experienced in the net present value. They include either the internal rate of return becoming equal to, falling below or becoming higher than the desired return standard. One of the reasons for the preference of internal rate of return is its lack of complexity when performed during comparison with the cost of capital. This is especially true when expressed as a percentage. There is a similar experience when compared with the return standard. In most cases, the outcomes proceeding from a project show an influenced pattern exhibited by the cash flow and the economic life. In order to obtain the internal rate of return, we make this an independently variable within the cash flow as well as within the economic life.
Payback Period
Payback period is the amount of time taken in years to regain what one puts in as an investment. Doing an analysis for the payback period enables the business to assert its threats as well as liquidity. In computing the payback period, the initial investment divided by the annual cash inflow. In the case of discounted payback period, the computation factors in the period taken to earn the money. One can obtain this by adding current value of every year’s cash inflows until they match with the initial investment. It is expected that the time taken for the payback period will be extended when the method of discounting is applied. This is because the financial worth decreases overtime. There is increased utility for the payback period because of the flexibility and ease in use. In addition, its method is not difficult to understand. One will appreciate this as a useful tool especially when used to compare similar investment cases. When used as an independent tool for comparison between doing an investment as opposed to not doing so, the payback period will not have to be exclusive when preparing for decision-making. There is a possibility for rectification of time value for money when a weighted average cost of capital discount is applied.
Monte Carlo Method
The Monte Carlo method performs statistical sampling simulation by use of a computerised system. One can do this in order to provide solutions to multiple mathematical problems. The method is suitable for problems without bases for probability calculations or structure. However, this does not present any advantage with regard to other methods of approximation. Monte Carlo method has an inherent absolute error for estimates. This reduces with n-1/2 while in other cases where all numerical methods that apply the n-point fir evaluation on m-dimensional space contain a calculation with approximate solutions. In the absence of exploitable special structure, the rest have errors that decrease with respect to n-1/m. This possibility gives the Monte Carlo Method an upper hand with regard to efficiency especially when doing the computation. This is possible with increase of m and describes the range of the complexity. One can illustrate character of complexity in a combinational setting. In other words, the Monte Carlo method serves better when used with simulation systems that have many paired degrees. This method is best suited for phenomena that have uncertainty in terms of their inputs. This means it is applicable in business ventures that have an element of risk. The method came into being in the 1940s courtesy of John von Neumann, Stanislaw Ulam and Nicholas Metropolis. They developed the method while engaged on a nuclear weapon project at Los Alamos National Laboratory. There are particular patterns in simulations that the Monte Carlo Method is consistent with and within which the inputs range. Within the defined domain, it generates the inputs randomly in a probabilistic distribution with the methods and gives aggregate results.
Analysis of Background
By performing the analyses, it provided the project with a greater need to provide the company with a platform to determine the most suitable option between two. In addition, background details provided to that end. These are as presented in the table below.
Table1 shows Financial Analysis Overview of the Case Study and Options provided.
Considering the two options provided, making improvements on the existing facility will cause minimal disruption on the operations. On the budget side, the project proponent will incur higher initial expense in building a new facility than improving the existing facility.
Improving Existing Facility
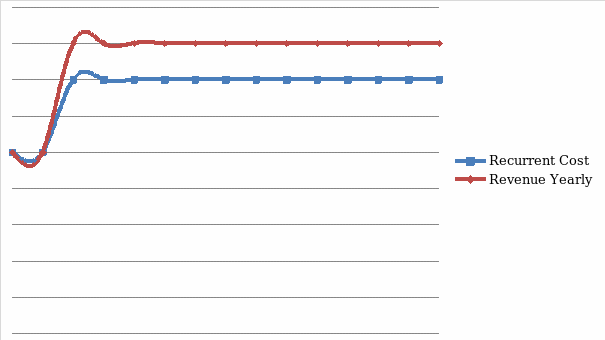
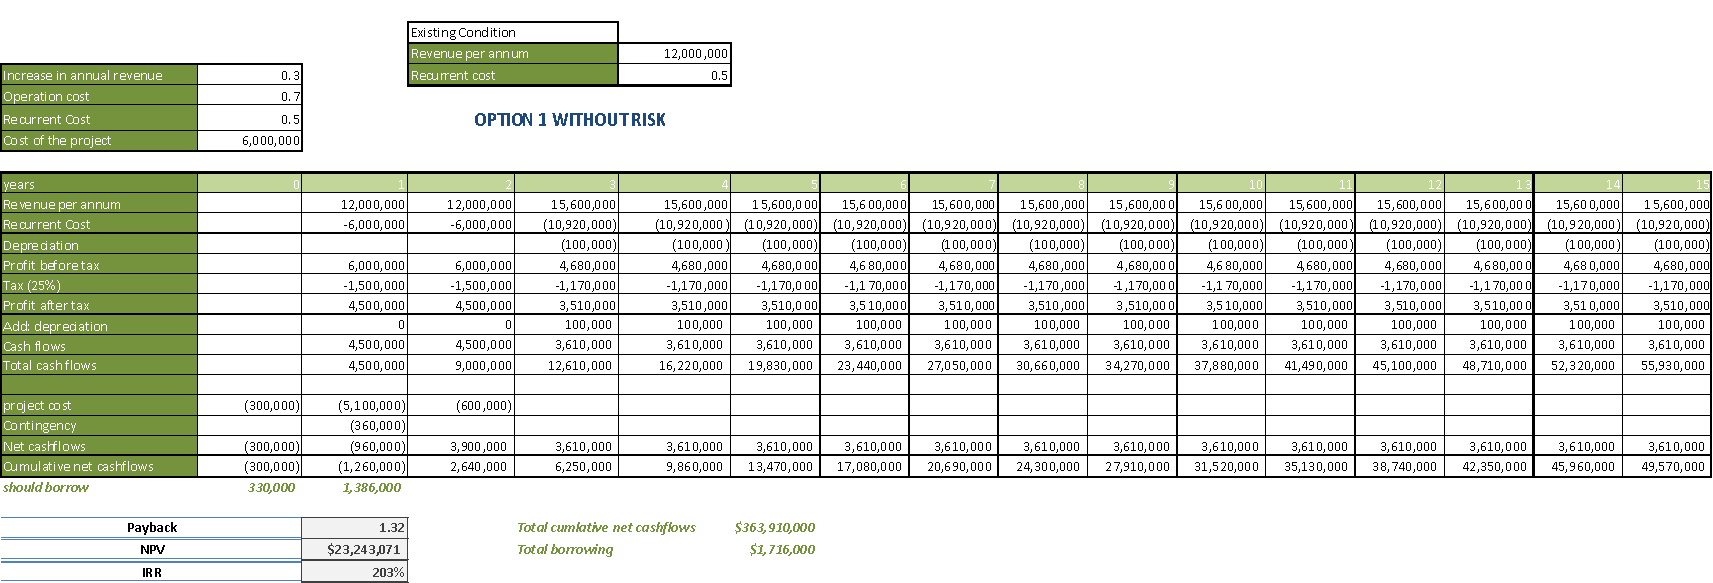
If the project proponents settle for the renovation option (option1), then this promises to improve the revenue. The increase will occur within a period of 3 years. The project will have an increase of annual revenue of 30%. After two years of doing the improvement of the buildings, the recurrent cost of project will rise from the current $6,000,000. In addition, after completion of the project the profit accrued will reduce by up to $990,000 on yearly bases. The capital investment injected into the renovation is recoverable within a period of 15 months. The statistics show that the internal rate of return will double while the net present value will be on the rise and this will be a positive indication. The project will have to source funds from elsewhere to cater for the deficit incurred at the beginning of the phases until the end of the first year. The project will experience a total net cash flow of $363,910,000 during the project period, with the project starting to earn cash flow benefits as from the second year.
Project Results
Setting Up a New Facility (Option2)
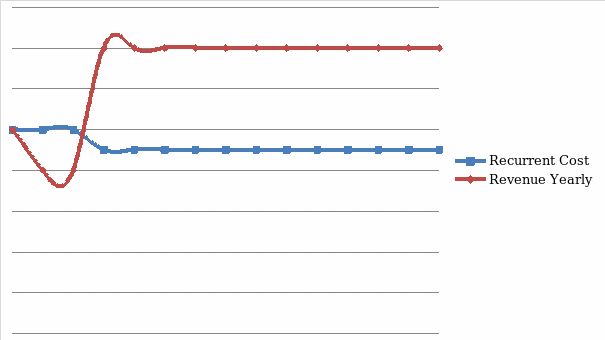
Exiting the old building to pave way for construction of a new facility will cause a 40% drop in the current revenue earnings. During the construction works of the new facility, there will be a need to shift or abandon some of the operations pending completion and occupation. This will cause an initial sharp drop in revenue during the undertaking affecting the second and third years. However, on the fourth year of operation, revenue will rise to $20,400,000. From the fourth year onwards, the amount will remain constant. There will also be a 5% reduction in the recurrent cost. From the revenue generated, the project will earn a profit of up to $8,215,000 annually. With the construction of a new building, the project will take up to just above four and half years to recover the initial cash investment committed to the project. The figure posted for the net present value is $32,430,536. This means the net present value will be large and positive. The internal rate of return will also post a promising percentage figure. The cumulative net cash flows for the whole duration of the project will be running at $474,270,000. The project will start earning cash flows benefits as from the fifth year. To cater for the first five years cash flow shortage the project ought to pump in $29,500,167 from an external source to fill up the deficit.
Project Results
Contrasting both Options
The financial analysis conducted below for both options is for a case where there is no risk present. The revenue generated before the proposed adjustment on the projects was $12m with a recurrent cost of $6m. The profits generated then were at $4,500,000 for each year. When the project proponents decide to operate at option1, the revenue that the project generates on yearly bases will be $15,600,000. Out of this, the project will make a profit of $3,610,000. The project will be facing recurrent costs $10,920,000. Under option1, the project will make a cumulative net cash flow of $363,910,000. When the project settles for the option2, revenue on yearly bases will be $20,400,000. From the revenue, the project will make a profit of $8,481,000. Under option2, the project will incur a recurrent cost of $9,180,000. The project will have a total cumulative net cash flow of $474,270,000. Option2 compares better than option1 on several issues. These include revenue per annum, profit generated on yearly bases, recurrent cost, net present value as well as total cumulative net cash flow. The only key factors that are favourable under option1 are the payback period as well as the internal rate of return.
Representing the revenue yearly and recurrent costs


In the above analysis, option1 promises less than option2. The fact that in both options the revenue generated will be on the rise; the recurrent cost for option two will decline while those for option1 will rise. The new facility provides newly enhanced gaming facilities, new operation concepts, and cost saving technology and fixed costs. However, with respect to option1, there could be a rise in the cost of maintenance of the building. At some point in option2, the project will borrow cash from an external source to fund the completion stage for the project thus incurring higher costs as opposed to option1. However, with option2 there is a chance to double the profit made. The option2 promises higher total cumulative net cash flows during the project period. This is quite promising considering the fact that the sum of money involved is considerably large approximated at $110,360,000 during the project period. In the long term, the figure expected to rise further. Therefore, the second option presents a better deal especially considering the present net value. However, with the internal rate of return, option1 is better than option2. Comparing the situation provided by the net present value over that provided by the internal rate of return, second option still stands out.
When considering the risk factors during the analysis several issues after arose. Compared to that of option2, the payback based on mean for option1 of the project is lower. Thus, for this case scenario the most preferred option for the project will be option1. However, the situation is different when one spreads the payback. The payback for option1 is higher than that of option2. This makes option2 the most preferred under such circumstances. The net present value for option2 stood much higher than that of option1, basing the calculation on the mean value therefore making option1 least preferred to option2 based on these circumstances. However, by spreading the net present value the situation reverses. option1 became more preferred than option2. For the case of the internal rate of return calculated based on the mean, the percentage for option1 was almost four times that of option2 thus making option1 more preferable than option2. By spreading the internal rate of return, option2 becomes the most preferable. However, by conducting analysis with respect to the risk factor, option1 becomes better than option2. The spread of risk in the payback period in the first option looks slightly larger than that of option2 with negligible impact compared to the 15 years thereby increasing option1’s risk probability of occurrence by 2 months. Furthermore, the mean returns in terms of payback for option1 is better than option2.
Conclusion
A summarised preview can give an overall conclusion. However, determining which of the two options to take at this point will be a painstaking affair. Either of the two options failed to post results that were conclusively better than those of the other. For example, when the aspect of loan is considered, Option1 was preferred. The same applies to the case of internal rate of return. This is for the case where there is a risk factor. On the other hand, considering the case without the risk factor, option2 stood gave better results in terms of internal rate of return as well as cumulative net cash flow. The payback based on the mean for option1 of the project become lower as compared to that of option2. On overall with respect to cumulative net cash flow, option2 is more preferred than option1.
Recommendation
When one aggregates and does a comparison between the two options in order to reach a final overall standpoint it will be necessary to consider each aspect carefully in order to determine the marginal advantages of each option. This should be done considering the two options within the factors of risk and without risk. Since neither of the two options has a clear lead but rather but rather give best results depending on the nature of combinations involved, it will be necessary to determine the key combinations in order to come up with the better option between the two. When analyses were done without risk, option1 was preferred for the aspect of loan and internal rate of return. The results of net present value, payback as well as cumulative net cash flow option2 stood out as the better option. By aggregating the results for both options, option2 stood as the better option. By considering the situation without the risk factor, option2 stood better off in terms of internal rate of return as well as cumulative net cash flow. The option1 was much better for the case of net present value, loan aspect as well as payback. This made the option1 preferable overall. For the case of cumulative net cash flow, option2 stands to be preferred over option1. However, option2 seems only to be favourable when the payback is without risk. This means that with the new facility in place, it will on board greater experience in terms of new concepts, new infrastructure as well as efficient technology. When there is no risk; option1 has a shorter payback period as opposed to option 2. In conclusion, option 1 would present a better deal with respect to the favourable nature to cope with risks better than with the second. However, there remains a greater need to critically analysis all possible combinations with respect to the project and determine the key elements that will affect the institution in order to make a rigid and candid decision.
Assumptions
There are assumptions the financial analysis had to consider. There is a 60 year depreciation life of 60 years using the straight-line method. The project costs are not tax deductible. There is tax at a concessional rate of 25% of profit. The dollar was the universal currency.


