Introduction
The study of social trends using virtual platforms, including Twitter, has applied value to marketing and social research. In this paper, metrics for five sets of keywords were evaluated using Twitter. This allowed conclusions to be drawn as to which ones were more popular, which makes sense for the further development of the research project.
Methodology
The central basis for the methodological approach for the execution of this paper was to search for keywords on the Twitter platform. Twitter is a globally known social network with over 320 million users, over fifty percent of whom visit the site daily (SRD 2021; Newberry 2021). These numbers were enough to choose Twitter as a virtual environment for exploring current trends. The built-in search bar was used to search for key queries related to the topic under study, namely environmental sustainability. The following terms were used for the search:
- #sustainability
- #natural_resource
- #renewable_energy
- #recycling
- #global_warming
However, using Twitter’s built-in functionality did not allow measuring the social metrics of interest, so it was decided to use the BrandMentions platform, which examines the number of mentions, interactions, reach, shares, and likes for a particular tag (BrandMentions 2019). All regions and all languages were selected to customize the analysis, allowing for more comprehensive statistics. The only limitation of this method was that the data was only collected for the most recent month, that is from November 20, 2021, to December 20, 2021, which means it reflected trends and patterns specific to that period only.
Results and Critical Analysis
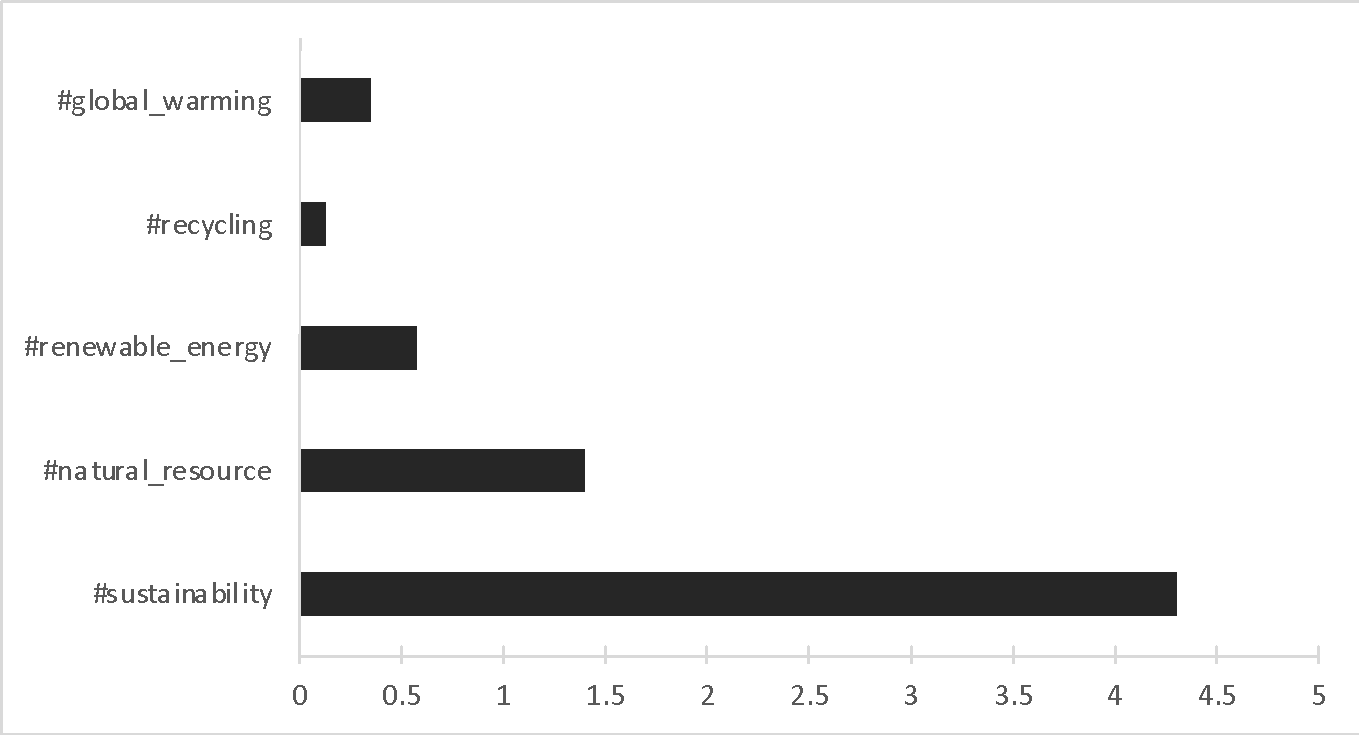
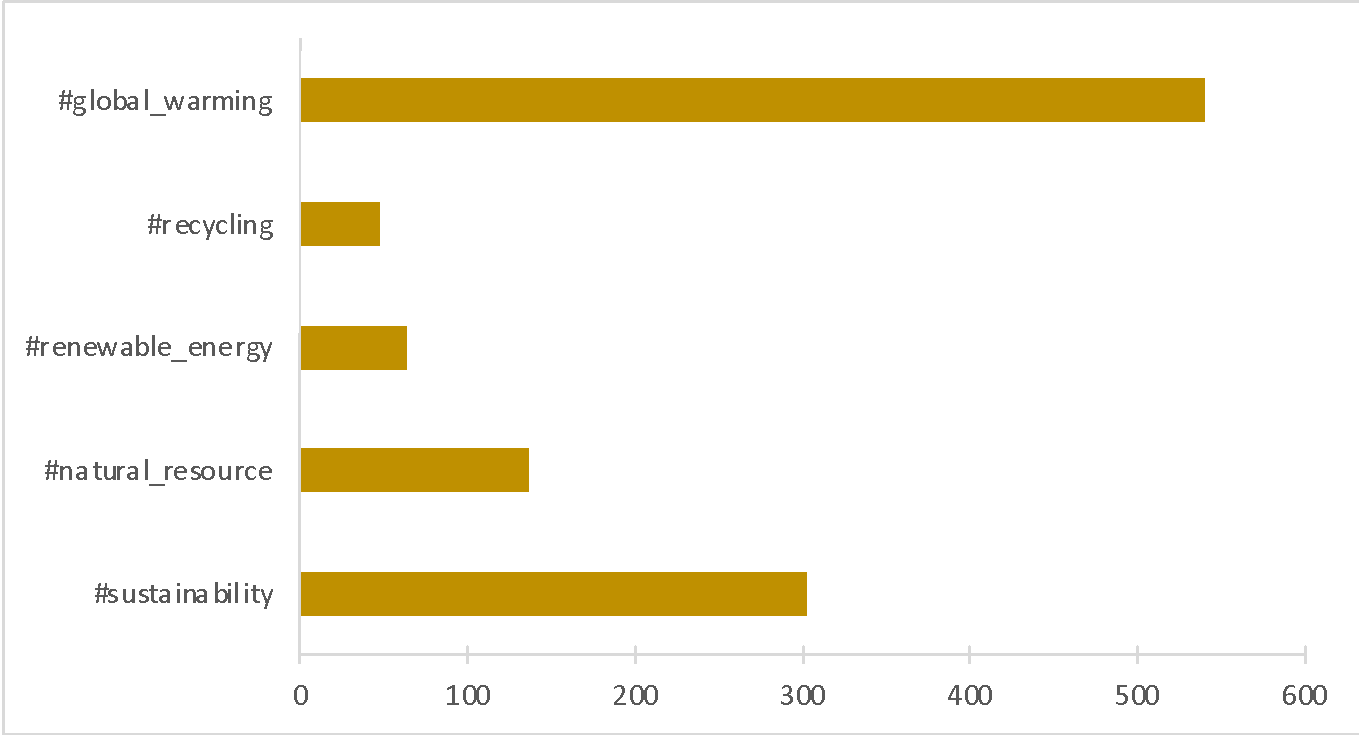
Since this study was conducted by collecting numerical data on the popularity of specific hashtags on the social network Twitter, a quantitative approach to their processing was relevant to the project. Processing the results using MS Excel visual tools produced distribution histograms for each specific metric. Thus, using Figure 1 below, it can be determined that the highest number of mentions was for the key query “sustainability,” while the lowest number of users referred to the query “recycling.”
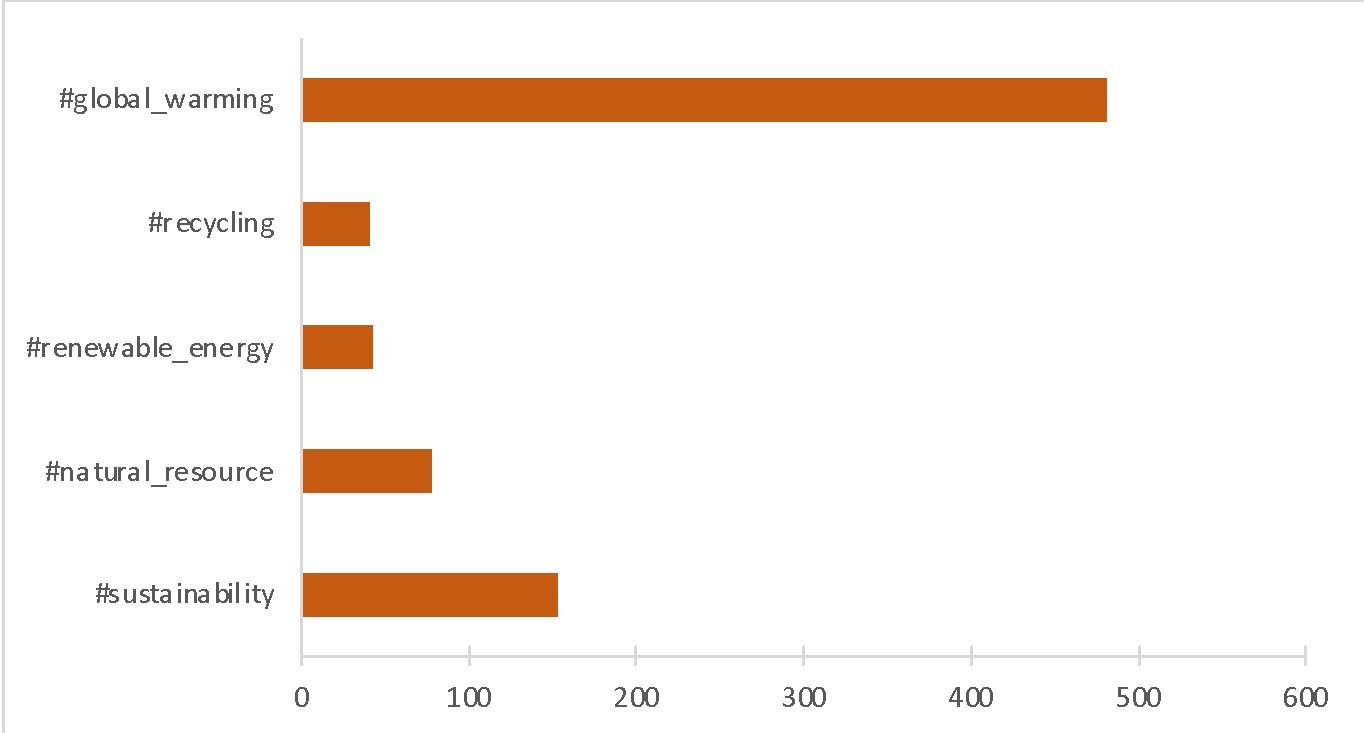
Similar results were found for the number of interactions with tags. Interactions refer to any clicks and clicks on posts that mentioned a key term. Figure 2 shows the general trends: “#global_warming” outperformed all other terms by at least 1.8 times, while “recycling” again had the lowest number of user interactions.
Reach was the third metric of interest for analysis; it includes the total number of Twitter users who have seen that key term at least once in the past period (Chen 2018). Clearly, the scale of this characteristic should be meaningfully broader, and so Figure 3 shows trends in millions of reach units, as opposed to other metrics. It is important to emphasize here that millions do not include unique users, but rather everyone in general, which means that if the same person caught the post twice, it counted as two reaches.
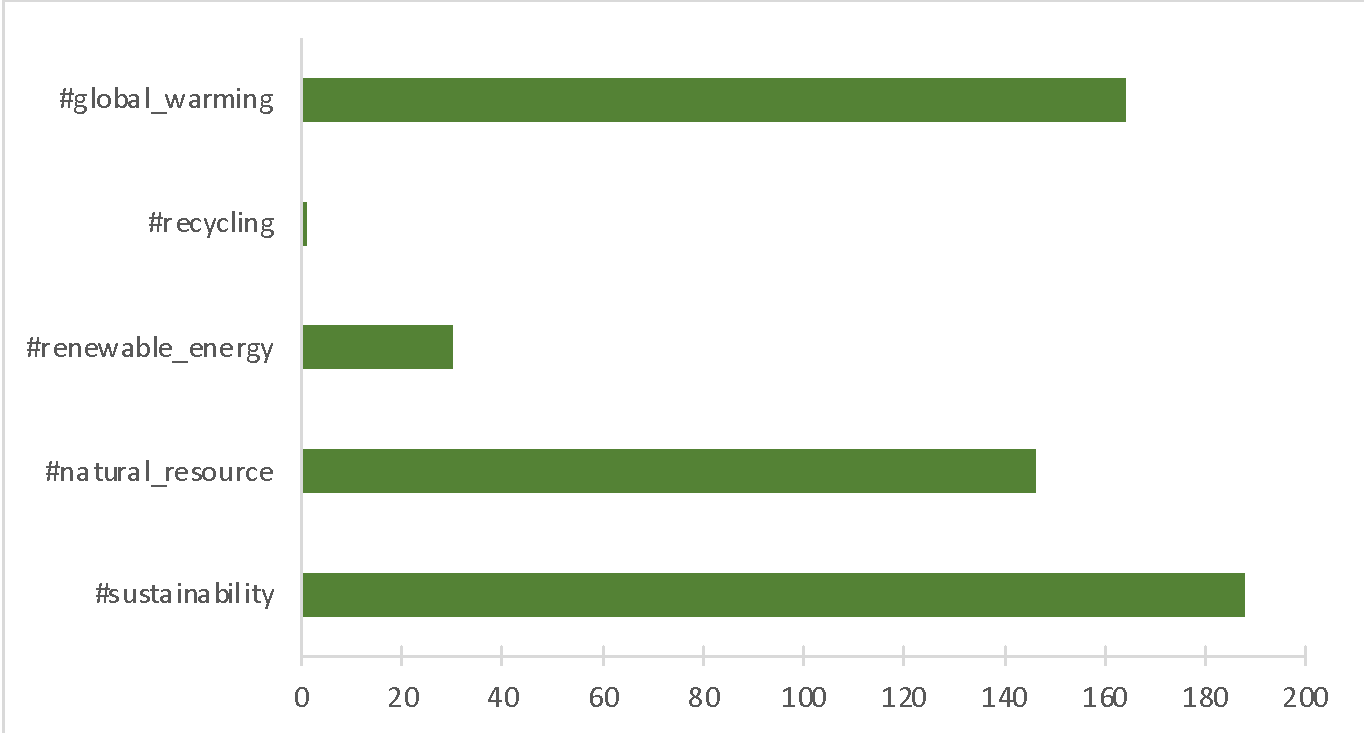
The number of shares among users corresponds to the situation when a person finds himself interested in the content and forwards it to his friends or relatives. Figure 4 gives exciting results in this regard: the highest number of shares was for “sustainability,” while for “#natural_resource” and “#recycling,” these numbers did not differ by more than 0.5%.
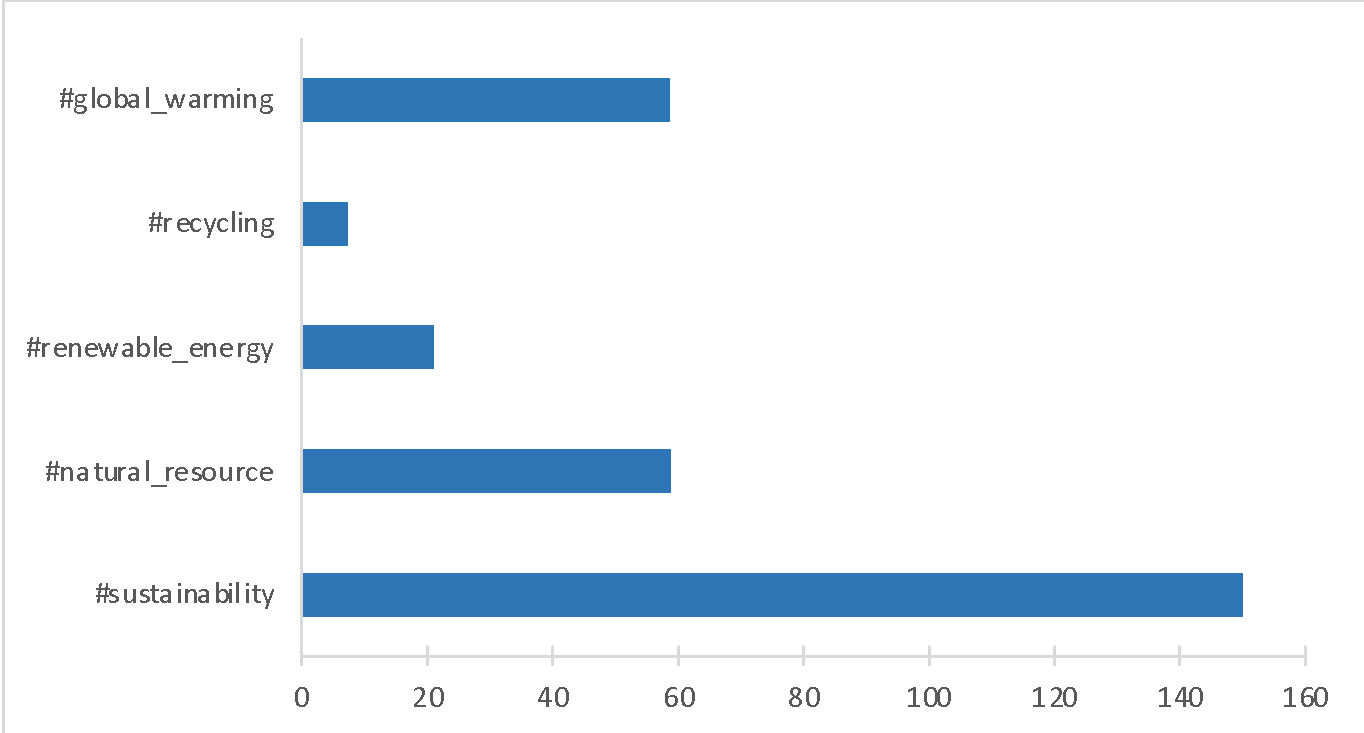
Finally, one of the most “tangible” characteristics is the number of likes, which reflects how much users like a post with a particular tag. Figure 5 reflects similar data to interaction statistics: “#global_warming” was again ahead of everyone else, and its lead was double that of “sustainability.”
It was interesting to determine further how each of the metrics is related to the others. To do this, a multiple pairwise correlations was performed, yielding Pearson coefficients for the five dimensions (no. = 25) (Zach 2020). Table 1 presents a matrix of these coefficients at the intersection of each of the two criteria. From these measurements, it is clear that the highest positive correlation was for the “interactions and likes” pair, while the lowest positive correlation was for “interactions and mentions.” If we examine the strength of the correlation modulo, the “likes and mentions” revealed the weakest correlation with each other at all.
Table 1. Paired correlation matrix with indication of Pearson coefficients

Conclusion
To summarize, measuring virtual metrics for marketing or social research is a sound strategy for studying underlying trends. Social networks best reflect this agenda, as they are visited by tens and hundreds of millions of people every day, which means they are representative. In this paper, Twitter was chosen as the platform, which is known as a social network for expressing one’s thoughts through short posts. For the set of five keywords, it is shown that specific metrics differ depending on the term: while “#sustainability” had the highest number of mentions, reach, and shares, in terms of likes and interactions, the leader was “#global_warming.” At the same time, the trend of “#recycling” was the least interesting for users in the past month on all points at once. A matrix correlation analysis was also conducted, which showed a close strong correlation between interactions and likes and an extremely weak negative correlation between mentions and likes.
Reference List
BrandMentions (2019) Web.
Chen, J. (2018) What are Twitter impressions & why are they so important to Twitter? Web.
Newberry, C. 36 Twitter stats all marketers need to know in 2021. Web.
SRD (2021) Number of Twitter users worldwide from 2019 to 2024. Web.
Zach (2020) How to read a correlation matrix. Web.