Introduction
The purpose of this laboratory work is to study the phenomenon of artificially created standing waves. The main property of standing waves is the successive alternation of nodes, in which the wave frequency is zero and peaks. It is known that the characteristics of standing waves are influenced by multiple factors, including the spring tension force. In the work, standing waves are created using an electric vibrator; the values of the tension force and the corresponding wavelengths are recorded for the wave. From this data, the dependence of the wavelength on the root of the tension is plotted to determine the slope factor; this factor can be used to calculate the frequency of the wave indirectly.
Data and Analysis
In the present laboratory work, an electrically driven vibrator was used to create standing waves, which allowed the wave frequency to remain stable throughout the test. For the string for which the specific gravity was unchanged, the values of its tension, τ, and wavelengths were measured in order to construct a relationship for them subsequently. Reference to theoretical information shows that the wavelength is linearly related to the square root of the tension force:

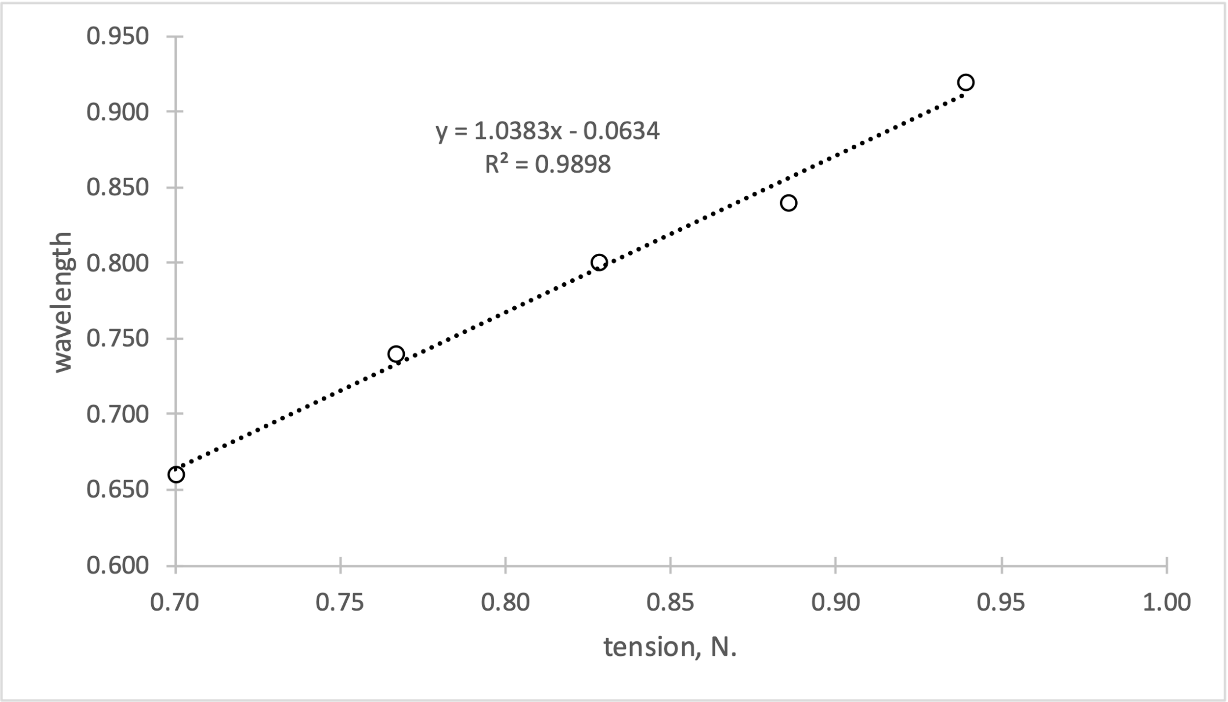
Accordingly, if one plots the dependence of the wavelength on the root of the tension, one expects the dependence to be linear under ideal conditions. Referring to Fig. 1, plotted on the experimental data, allows us to confirm this. The coefficient of determination for this experiment was highly high (R2 =.99), which implies that the linear model perfectly satisfies the relationship between the variables (Bloomenthal, 2021). The slope (m/√N) of this regression is positive, which means that as the root of the tension increases for every one newton, the wavelength will increase by 1.0383 metric units. As the wavelength increases, there is a corresponding increase in the velocity of propagation of these waves.

From this value, the frequency for this standing wave can be calculated. As follows from the formula:
Consequently, the slope in this model is:
Considering that
Then,
The source of errors for this experiment are measurement uncertainties. It is worth specifying that since in standing waves with longer wavelengths the distance between the points is greater, so it was easier to determine the nodes just for these wavelengths. When finding the wavelength of one loop at a time, the measurement error seemed smaller, since such a measurement was more accurate and targeted, as opposed to measuring several loops at once at a time. When measuring the force of the string tension
Conclusion
In the present laboratory work, the slope coefficient calculated in the regression linear model was used to calculate the standing wave frequency. Since the characteristics of standing waves are known to depend on string tension, the tension force was used as an independent variable. Remarkably, the results confirmed the expectation of linearity in the dependence of the wavelength on the string tension force. The deviation and errors could have been due to the presence of measurement uncertainty for ultra-small values. Meanwhile, the measurement of tension was also associated with uncertainties, with increasing mass increasing this tension. It is not possible to calculate precisely how much the mass might have changed in order to maintain the standing wave trends. Nevertheless, it is clear that even with increased mass, standing waves could be achieved if the vibrator was given a certain frequency.
Reference
Bloomenthal, A. (2021). Coefficient of determination. Investopedia. Web.