- Salaries distribution and promotion rate for new employees
- The average annual growth rate for 1999 – 2015 and projected sales for 2017
- The standard deviation and the variables
- The characteristics of the workforce and the company’s expectations
- The number of positions per job title and the mode of the job title distribution
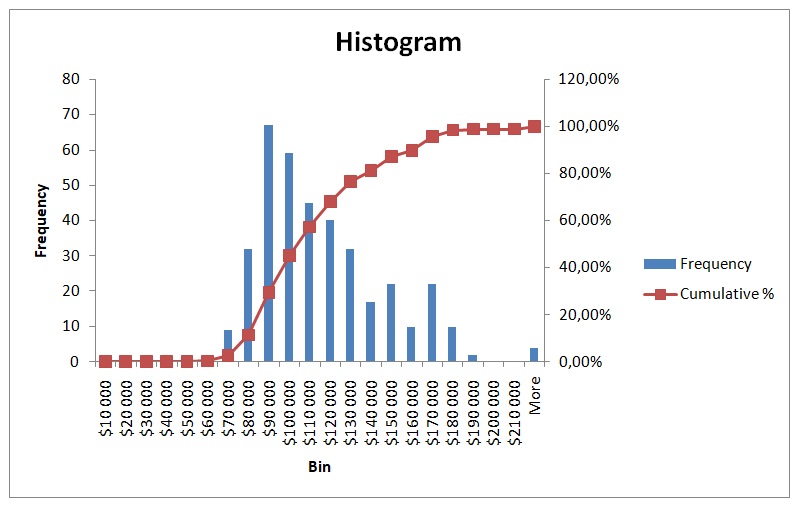
Salaries distribution and promotion rate for new employees
The histogram shows that the distribution of salaries among employees exhibits bimodal distribution. The distribution is bimodal because there is a peak at $90,000 (Mode = 67) and another peak at $150,000 (Mode = 22) and $170,000 (Mode = 22). The bimodal distribution is a right-skewed distribution for the mode on the right side is smaller than the mode on the left side of the distribution. In essence, the distribution is asymmetrical for one peak is greater than the other peak. The existence of bimodal distribution indicates that there are two classes of employees, one class that earns low salaries and another class that earns high salaries. Normally, bimodal distribution occurs when a sample comprises individuals from two different populations. One mode exhibits distribution peak of one population whereas another mode depicts distribution peak of a different population. Therefore, what is evident in the depiction of the distribution is that the minority of employees earn high salaries while the majority of employees earn low salaries.
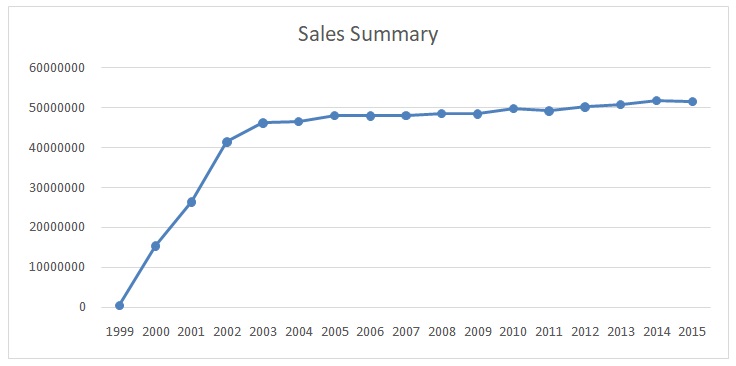
The average annual growth rate for 1999 – 2015 and projected sales for 2017
The average annual growth rate for 1999-2015 was calculated was calculated using the formula {(This year sales – Last year sales)/Last year Sales}/2. The average annual growth rate for each year was tabulated as shown in the tables below.
Projected sales for 2017 was estimated using the average annual growth rate of 2016, which was in turn estimated by the average annual growth rate of 2015.
The average annual growth rate of 2015 = (51,702,000 – 51,850,000) / (51,702,000*2) = -148,000/103,404,000 = -0.00143
Projected sales for 2016 = 51702000 + (-0.00143*51,702,000) = 51,628,211
The average annual growth rate of 2016 = (51,628,211 – 51,702,000) / (51,628,211*2) = -0.00071
Projected sales for 2017 = 516,628,211 + (-0.00071*51,628,211) = 51,591,369
The standard deviation and the variables
The variable of salary a standard deviation of $32,350.21 showing that it values are more dispersed around the mean of $111,379.48. Moreover, the range of salary depicts high dispersion because its value is $231,063 with the highest value as $290,210 and the lowest value as $59,147. The variable of the hourly rate exhibits more dispersion of values around the mean (M = 53.55) because the standard deviation is 15.55. The range of hourly rate is 111.09 with the lowest value as 28.44 and the highest value as 139.52, which is broad, and thus indicates that there is an extensive variation in the hourly rate among employees. The variable of the year of service shows a little dispersion of values around mean (M = 6.89, SD = 4.08). The lowest value is 0.39, and the highest value is 15.79 having a range of 15.41, which is narrow. Besides, the variable of education shows that the education level of the employees is slightly variable for the standard deviation is small (M = 15.45, SD = 1.79). The range of education level is narrow (8) with the lowest and the highest values being 12 and 20 respectively. The variable of age is moderately variable for the standard deviation is moderate (M = 35.83, SD = 9.70). However, the range of age depicts a high variation for the range is 44 with maximum and minimum values being 62 and 18 respectively.
The characteristics of the workforce and the company’s expectations
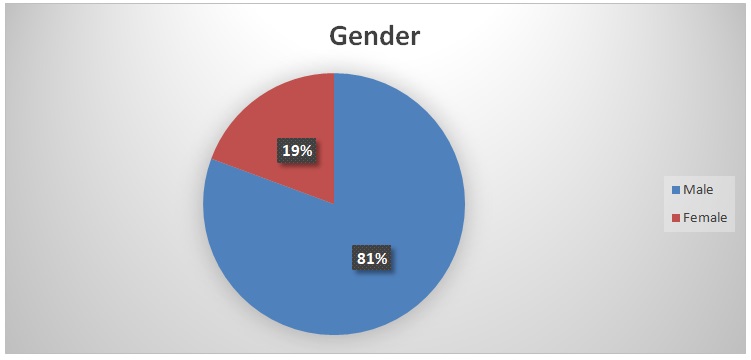
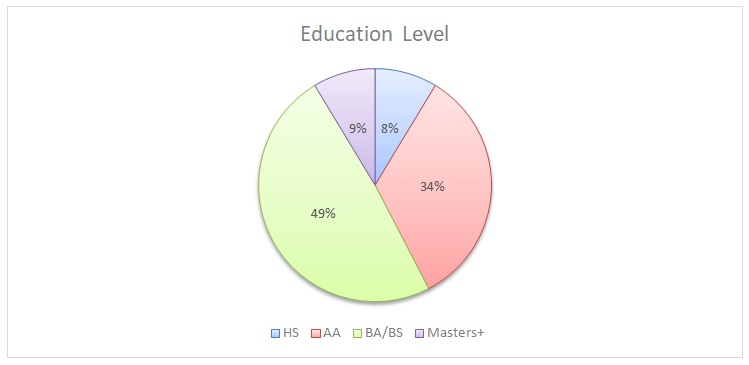
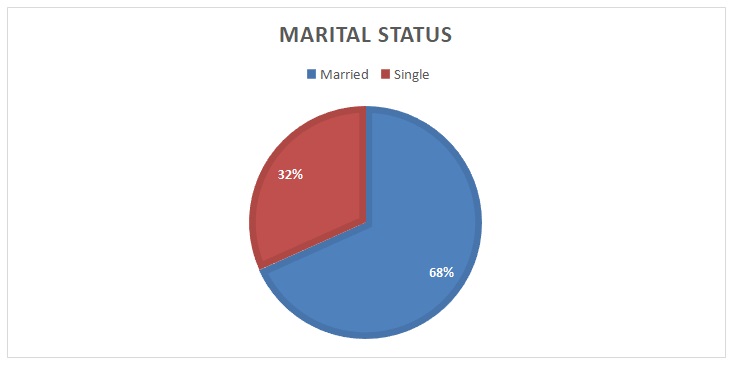
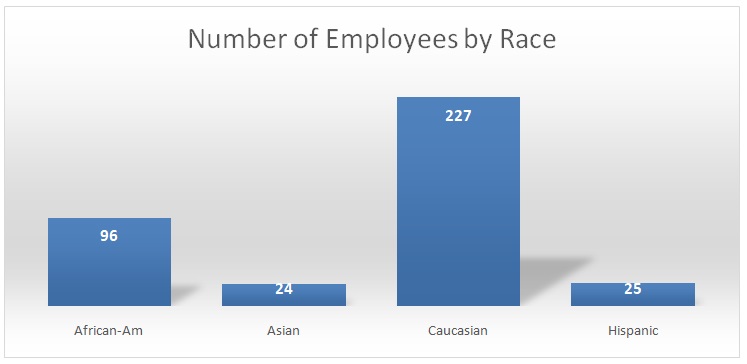
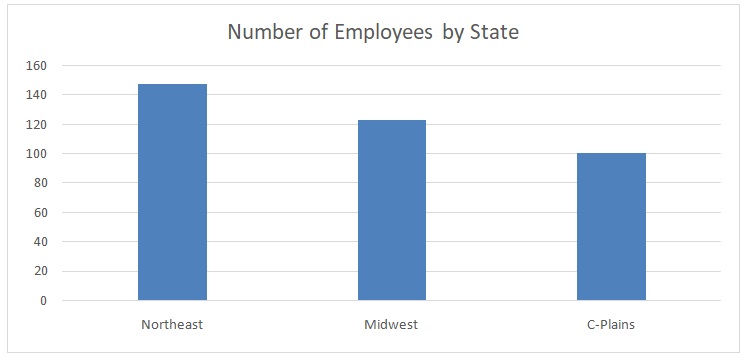
The examination of charts indicates that the workforce is diverse regarding gender, educational level, and race. From the pie chart, it is apparent that female employees comprise the majority (81%) while male employees comprise the minority. In education level, the pie chart shows that employees with BA/BA comprise about half of the employees (49%) followed by employees with AA level of education. Employees with masters’ level constituted 9% of employees while employees with high school level of education formed the lowest proportion of employees (8%). The bar graph depicts that most employees (61%) are Caucasians followed by African-Americans (26%). Asians and Hispanics comprise 6% and 7% of the employees respectively. To determine how the company meets the expectations of diversity, I would assess the balance of gender and racial proportions. In determining dynamism of employees, I would assess the educational level of employees for those with a higher level are more dynamic than those with a lower level of education.
The number of positions per job title and the mode of the job title distribution
The position of cyber analysts is the mode of the job title distribution because there are 159 cyber analysts. Forensics analysts rank second in number (40) followed by senior cyber investigators (27) and cyber software engineers (23). Malware reverse engineers and physical security officers are 18 each, public and business office team managers are 14, and accountants are 10. Investigators and IT staff are 8 each, cyber managers are 7, logistics, quality assurance, and advertising have 5 employees each, administrators are 4, and senior forensic managers and senior public and business office team managers are 3 each. The company has one employee in each of the following positions, namely, CEO, CFO, CIO, controller, COO, engineer manager, IT manager, logistics manager, logistics manager, public and business office team manager, and senior cyber analyst. To keep abreast with the demands of work, the company should create positions of senior cyber analysts and cyber managers that are commensurate with 159 positions of cyber analysts. Moreover, the company should create more positions of senior forensic managers to manage 40 forensic analysts. More positions of cyber investigators are necessary to meet the proportion of senior cyber investigators.