Abstract
The present section includes description of the analytical approach used in this paper. Thus, qualitative research based on secondary research is employed. This approach enables the researcher to collect the necessary data for the present analysis. The present analysis employs such variables as time, growth rate, external funds rate, production rate and population growth rate.
Methodology
To address the objectives of the present research, a qualitative method will be utilized. Secondary research will be implemented and data obtained will be incorporated in the present research. Secondary research will include analysis of books and peer reviewed articles. It is necessary to note that to explore the role of transformational leadership concepts, a variety of sources (books as well as peer reviewed journals) will be analyzed. Furthermore, data from the World Bank Group and the International Monetary Fund (IMF) will be employed. These data will be used to reveal particular indicators of the success of the economies of the four nations. The secondary research is chosen due to the time limit and certain geographical constraints as the subject of the present research is a set of several countries. It is necessary to note that there are certain limitations to the present research as the data collected from databases are available on certain periods only and more recent data can be obtained from secondary sources only.
Goldstein (2013, p. 163) notes that the growth of the BRICS has been continuing for a decade. Therefore, one of the variables of the present research will be time as it is essential to trace the development of the countries throughout the 2000s and 2010s to identify major factors affecting this growth. Another variable is GDP growth rate as these data also provide insights into development of the emerging markets. Marino (2012, p. 71) notes that capital flows contribute greatly to the development of the BRICs. Admittedly, the rate of external funds is an important variable as it will help identify the role of this factor on the emerging markets. Furthermore, production rate as well as fiscal policy of the countries will also be variables in the present research. Finally, population rate is another important variable as it has been acknowledged that population has enabled the countries in question to enter the global market and become some of the most prospective emerging markets (Ghosh, 2009, p. 24).
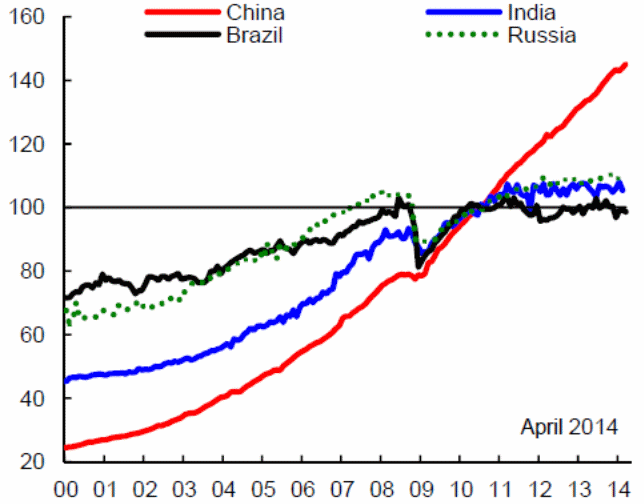
The present research will include a number of graphs which will be presented and analyzed. One of these graphs is retrieved from the review implemented by the IMF (Matsumoto & Rousset, 2014, p. 3). The graph shows the latest trends in the industrial production in BRICs (see figure 1). The period taken is the period used in the present research (2000-2014). It is clear that China is one of the most rapidly growing economies among BRICs. It is also seen that this country had the lowest rate at the beginning of the period measured. At the same time, China has the highest rate of industrial production now.
Whereas, the other three countries have rather modest growth even though the rate of this growth was significant up to 2008. Admittedly, the global financial crisis of 2008 had a negative impact on the development of the countries. Remarkably, China seems to be almost untouched by detrimental effects of the crises. At that, Russia is facing certain decrease. These rates can be explained by inflation in Brazil and India. Russian economy is facing a variety of constraints partially due to economic sanctions imposed by European countries, the USA, Japan and some other state. The present graph is valuable for the present research as it explicitly reveals the rate of industrial production in the countries in question.

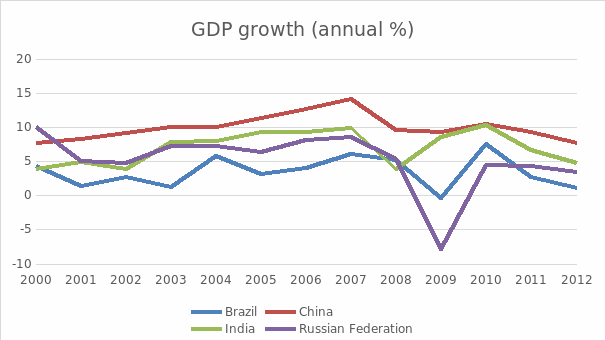
As has been mentioned above, GRD growth rate is also important for the present research. Therefore, another graph will be used. The graph is developed based on the data obtained through the World Bank database (see figure 2). It is noteworthy that the data is revealed for the period from 2000 to 2012. Even though it does not reflect the latest changes in the GDP growth, it is still valuable as it shows that the GDP growth was interrupted between 2008 and 2010.
Clearly, such global events as financial crisis tend to have a considerable impact on the rate of GDP growth. Again, the data suggest that China has had the highest rate of the GDP growth and it was not affected as substantially as other countries under consideration. The graph also supports the assumption that the four countries have been witnessing a lasting (and quite significant) growth. The data revealed also suggest that the countries recovered from the global financial countries since the growth continued even though the rate of this growth was considerably lower.

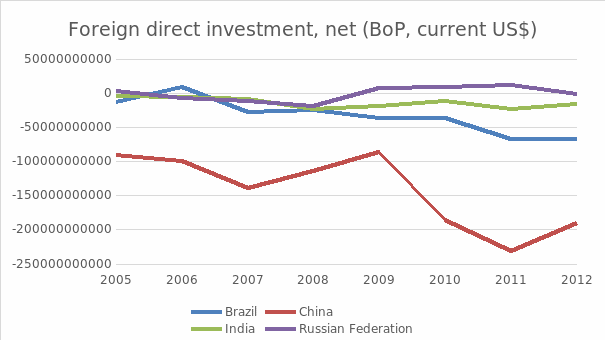
Another variable exploited in the present research is the rate of external funds (see figure 3). The graph is based on the data available in the World Bank database. It is noteworthy that the data reveal the rate in the period between 2005 and 2012, which imposes certain limitations. However, the graph still reflects the trend existing for a period that is meaningful. It is clear from the graph that China received the least amount of direct investment. At the same time, the growth of this country’s economy is the highest. Therefore, special attention will be paid to the structure of the Chinese economy and leadership concepts employed. These indicators will be compared with similar ones of the other countries. It is noteworthy that Russia got the most amount of direct investment and showed moderate and after the crisis of 2008 insignificant rate of growth. In the next section, the structure and leadership of this country will also be considered in detail.

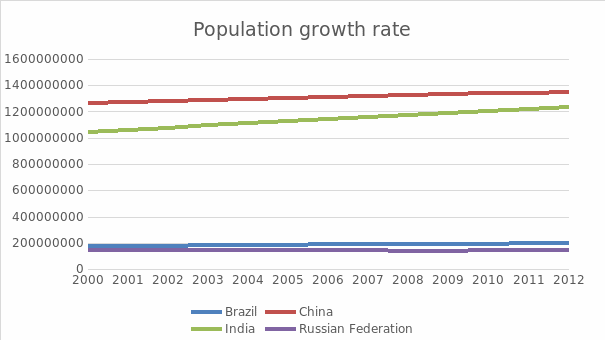
Finally, population is another variable which will be facilitated by the use of the graph developed on the basis of the World Bank database (see figure 4). This graph is valuable as it reveals explicitly the rate of population growth in the nations in question. Again, the data available cover the period between 2000 and 2012 but the trend has not significantly changed at present. Hence, the data are relevant. As seen from the graph, China and India are leading while Russia has the slowest rate of population growth. It is also noteworthy that the population is significantly larger in China and India as compared to the other two countries. This suggests that China and India have a significant advantage while Russia and Brazil may lag behind due to decreased labor force and consumer cohort.

Reference List
Ghosh, J. (2011). Model of BRICs’ economic development and challenges for EU competitiveness. Washington, DC: Thomas Nelson Inc.
Goldstein, A. (2013). The political economy of global business: The case of the BRICs. Global Policy, 12(2), 162-172.
Marino, R. (2012). Submerging markets the impact of increased financial regulations on the future growth rates of BRICS countries. Basingstoke: Palgrave Macmillan.
Matsumoto, A., & Rousset, M. (2014). Quarterly review of commodity markets. Web.
World DataBank: World development indicators. (2014). Web.