Introduction
World Vision Australia is a non-governmental organisation, which operates as a branch of the World Vision International Partnership. As a Christian organisation, the WVA’s mission is to eradicate poverty and its causes. The organisation has established its operations in over 90 countries. The organisation pursues its mission through the provision of relief, policy advocacy and change, the promotion of social justice, and personal growth. WVA is undertaking over 900 projects aimed at empowering local communities. Globally, the organisation helps over 2 million children annually.
Despite the WVA’s commitment to eliminating poverty and its causes, the organisation is experiencing a major problem due to economic changes. WVA mainly sources its funds from donations offered by the Australian public. However, due to the 2007/8 global economic recession, WVA has experienced stagnation in the rate of giving from the public over the past 5 years. According to Scaife, McDonald, and Smllie (2011), giving amongst the wealthier Australians is relatively lower as compared to other countries. According to DFNS (2015), between 2007 and 2008, the number of high net-worth giving declined from 169,000 to 129,000, which represents a 23.4% decline. The reduction in the rate of giving has continued. Between 2011 and 2014, the on-going pledge programs in Western Australia declined from 20% to 11% (DFNS, 2015). This paper reviews the available literature review on the current trends with reference to charitable giving in Australia.
Literature review
Australia’s economic performance
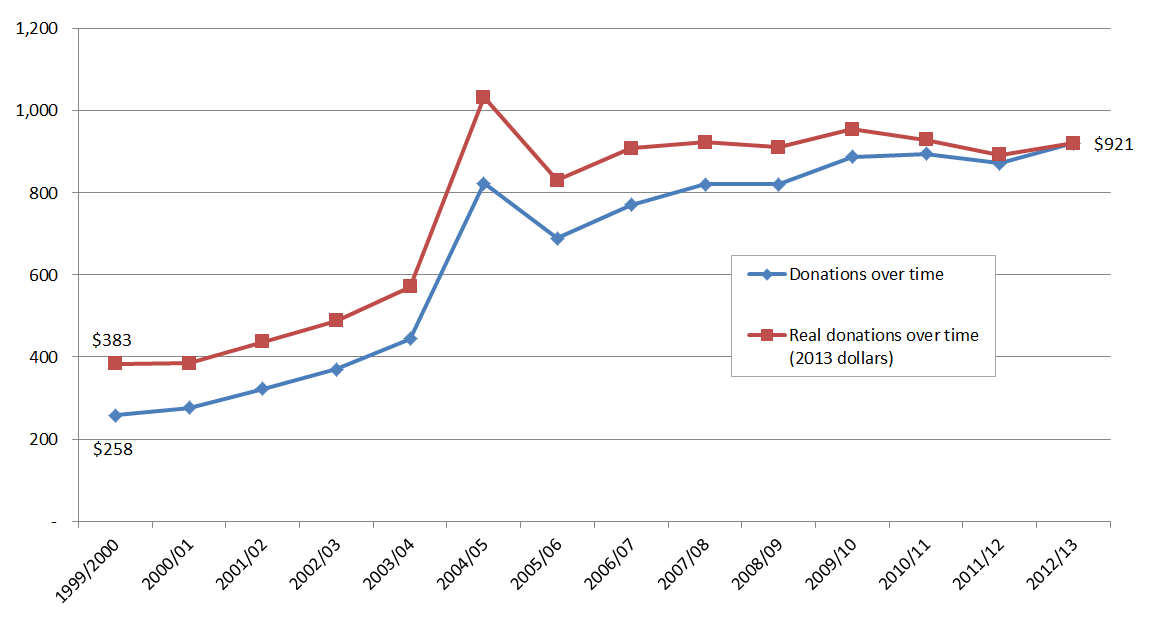
A study conducted by DFNS (2015) shows that giving to non-governmental organisations [NGOs] increased significantly from 1999 to 2004. However, the performance declined considerably, as illustrated by graph 1 below.

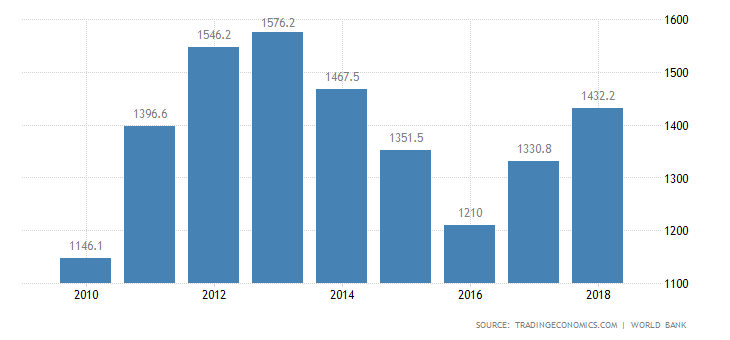
Most Australians have experienced significant improvements in their purchasing power over the past decade, which has arisen from the country’s economic growth. According to Trading Economics (2015), Australia’s Gross Domestic Product [GDP] increased from US$ 348.54 billion in 1960 to US$1,560.60 billion in 2013. Its GDP is estimated to account for 2.52% of the global economy. Graph 2 below illustrates the trend in the country’s GDP.

The Queensland Government Australia (2014) emphasises that Australia’s economy ranks amongst the most resilient to economic cycles in the world. From the graph, it is evident that the country’s GDP was relatively low between 2007 and 2008. However, the economy has rebounded over the past few years, as illustrated by graph 2 above. Growth in the country’s GDP has been spurred by the positive economic performance in the different economic sectors. Some of the most important economic sectors in the country include tourism, mining, and the agricultural sector. These sectors have created employment opportunity for a considerable number of citizens, which has translated into an improvement in the citizens’ disposable income.
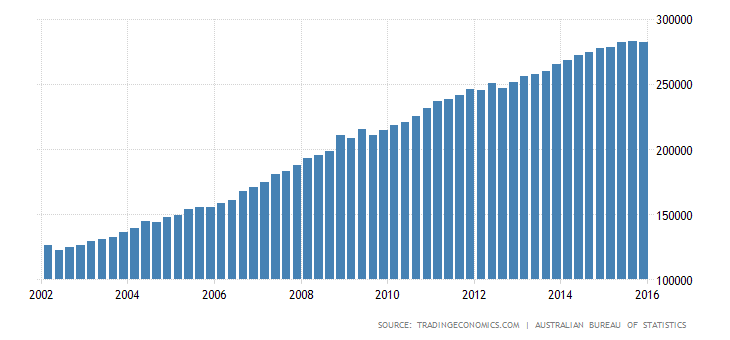
Over 72% of citizens aged between 15 and 64 years have a paid job. This rate of employment is considerably higher as compared to the average rate in the OECD countries, which is estimated to be 65%. Moreover, 78% of men have paid jobs as compared to that of women, which is 67%. The high rate of employment explains why Australia has experienced considerable growth in the rate of giving over the past decade. Graph 3 below illustrates the trend in the country’s disposable income over the past decade. From the graph, it is evident that most Australian’s have experienced a considerable improvement in their purchasing power.

OECD (2015) records, “The net-adjusted disposable income per capita in Australia is US$ 31,197 a year” (par. 5). The country’s per capita income is higher than that of most OECD countries, which is estimated to be US$ 23,938. However, Australia is characterised by a substantial gap between the rich and the poor. The disposable income of the richest 20% of the country’s population is 6 times higher than the bottom 20% (OECD, 2015). Despite the gap, a study conducted by OECD (2015) shows that a substantial proportion of the country’s population (83%) have a positive experience with life, such as pride in accomplishment.
Scaife, McDonald, and Smyllie (2011) emphasise that feeling prosperous is a critical factor in inspiring individuals to donate to charitable organisations. Scaife, McDonald, and Smyllie (2011) affirm that large donations are mainly experienced amongst the large income earners as opposed to the low-income group. In spite of the fact that 87% of the country’s labour force donates to charitable organisations, their donations are significantly small. Only 8.6% of this population donated over AU$ 1,100. Most citizens donate approximately AU$ 3,000. On the contrary, consumers within the high-income group, viz. AU$ 100,000-AU$999,999, account for the biggest proportion of the total donations to charitable organisations. Scaife, McDonald, and Smyllie (2011) contend that a greater proportion of Australians in this income group “make and claim for their donations on their tax” (par. 14).
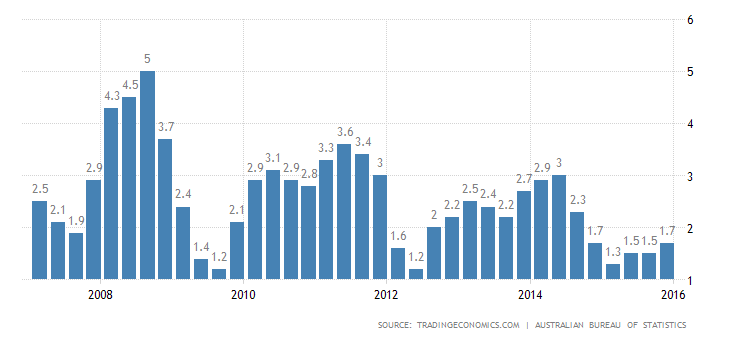
Despite the positive economic performance, Australia has experienced a considerable fluctuation in the rate of inflation. The country’s rate of inflation is relatively low. According to Trading Economics (2015), the country’s average rate of inflation from 1951 to 2014 was estimated to be 5.21%. During the last quarter of its 2014 fiscal year, the country’s rate of inflation was recorded at 1.7 %. Graph 4 below denotes the trend in the country’s rate of inflation from 2008.

Graph 4 above shows that the country’s rate of inflation has fluctuated considerably from 2008 to 2014. Fluctuation in the rate of inflation has translated into an increment in the consumers’ price index. This aspect has increased the degree of uncertainty on the country’s future economic performance. Subsequently, most consumers are considering maintaining their consumption lifestyle. Despite the resilient nature of the country’s economy, its future economic performance is uncertain, which has led to a remarkable decline in the consumers’ confidence.
Harjani (2014) posits that the consumer confidence index declined to 92.9 by the end of 2011. Harjani (2014) adds that if “the index is less than 100, it indicates pessimism on the state of the economy” (para. 5). The mining sector has recorded a significant increment in the rate of unemployment. Validakis (2014) asserts that the rate of unemployment in the mining industry is 12.2%. Despite the decline in the level of confidence, Gillespie (2015) emphasises that Australian “consumers have been remarkably resilient despite the increase in the rate of unemployment” (par. 2).
The trajectory of the consumers’ consumption behaviour is critical in determining a country’s future economic performance. Currently, the mining sector, which greatly contributes to the country’s economic growth, is undergoing a downturn. Gillespie (2015) corroborates that the mining sector employs approximately 2.2% of the total labour force in Australia. The significance of the mining sector to the country’s economy arises from the fact that the sector is well established in different territories. Thus, the mining sector has a direct impact on the country’s economy. This aspect means that charitable organisations in Australia are in a position to receive financial support through donations from a large number of consumers employed in the sector.
The situation has further been worsened by the government’s decision to cut welfare spending. Moreover, the Australian government announced its decision to increase the tax applicable to high-income earners. According to Scaife, McDonald, and Smyllie (2011), the affluent/ high-income earners play a fundamental role in sustaining the perennial donations to charitable organisations such as WVA. The decision to adopt these strategies has arisen from the need to deal with the increasing budget deficit. However, taxing the high-income earners will reduce their capacity to make donations. This scenario will arise from the reduction in their ability to claim taxable donations.
Harjani (2014) further contends that declining consumer confidence in Australia will affect the country’s business environment. In extreme conditions, these aspects limit the consumers’ capacity to donate to charitable organisations. Scaife, McDonald, and Smyllie (2011) are of the opinion that the consumers’ decision to donate is influenced by a number of factors. One of the most important factors entails their perception of the ability to donate, which depends on their financial situation. Additionally, the donation is influenced by the extent to which consumers feel comfortable with life.
Conclusion
From the above analysis, it is evident that donation to charitable organisations in Australia has undergone remarkable growth over the past few decades. One of the factors that have stimulated donation to charitable organisations is the high rate of economic growth experienced in the country. However, over the past few years, donation to charitable organisations within the country has flattened. One of the factors the factors that have led to this situation relates to the prevailing economic climate. The 2007 global economic crisis affected the country’s economic performance adversely. First, the country experienced a considerable increment in the rate of unemployment especially in the major sectors that support the country’s economy such as the mining sector.
Additionally, the country has been characterised by considerable fluctuation in the rate of unemployment over the past few years. This aspect has led to a reduction in the level of disposable income amongst a significant proportion of the country’s population. These elements have led to the fluctuation in the consumer price index, which has had a negative effect on the consumers’ level of confidence regarding the country’s future economic performance.
Apart from the prevailing macroeconomic environment, the flattening of donations to WVA has further been increased by the Australian government decision to increase the tax deductible amongst the high-income earners. This study shows that the high-income earners account for the largest proportion of the total annual donations to charitable organisations. However, the decision to increase the tax on high-income earners has significantly reduced their capacity to donate. Moreover, a decline in the level of consumer confidence in the country’s economic performance explains why the country charitable organisations’ market segment has been characterised by flattening of the annual donations.
Charitable organisations in Australia should formulate effective strategies that will contribute to an increment in the rate of donation despite the prevailing economic climate. Moreover, the government should support the charitable organisations through effective policy formulation such as taxation.
References
DFNS.Net: Australian public giving for international development flatlining. (2015).Web.
Gillespie, A. (2015). Australian economy showing stability amidst ongoing uncertainty. Web.
Harjani, A. (2014). Australia’s outlook rife with uncertainty. Web.
OECD: Australia; how is life? (2015). Web.
Scaife, W., McDonald, K., & Smyllie, S. (2011). A transformational role; donor and charity perspectives on major giving in Australia. Web.
Trading Economics: Australia GDP. (2015). Web.
Queensland Government Australia: Queensland tourism investment snapshot. (2014). Web.
Validakis, V. (2014). Unemployment for resource professionals hits double digit. Web.