Introduction
An important element of learning is to connect mathematical concepts with physical concepts. Graphical representations of mathematical functions allow one to visualize the meaning and power of mathematical equations. The power of computer programs and graphing calculators provide a thorough connection between algebraic equations and visual representation, fostering a heightened appreciation and understanding of mathematical language (Pierce, 2010, p. 1).
Situation
A person is planning on saving money according to a rigid savings schedule. Saving plan A is to make an initial deposit of $400 and then deposit $20 per month into the account. Saving plan B is to make an initial deposit of $600 and then deposit $10 per month into the account. Assuming that no interest is earned on money deposited into the account;
- The algebraic representations of the account balance (y) for the saving plans are:
- Saving plan A; y = 20x + 400
- Saving plan B; y = 10x + 600
- Where x represents the number of months
- Solving the two saving plans simultaneously, by the method of elimination;
- 0 = 10x – 200
- Therefore, x = 20, and y = 800
- That is, the two saving plans yield an identical balance of $800 after 20 months.
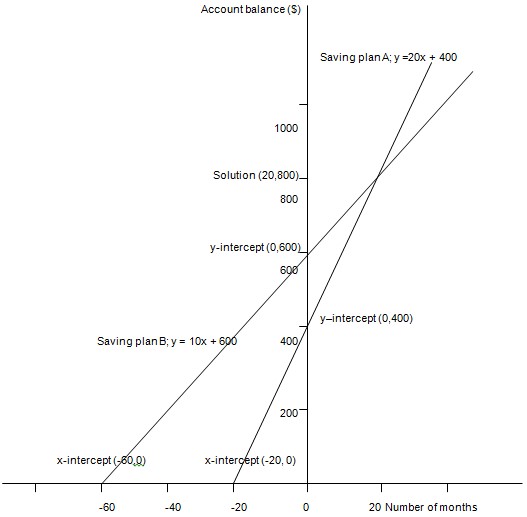
- For saving plan A; y = 20x + 400 the coordinates for the graphing are;
- For saving plan B; y = 10x + 600 the coordinates for the graphing are;

From the graph, it is quite evident that the saving plan B yields the greatest balance for that person who stops saving after 14 months. In 14 month saving period, the corresponding saving yields are $680 for plan A and $740 for plan B.
From the same graph also, it is clear that the saving plan A yields the greatest balance for a person who stops saving after 23 months. In 23 month saving period, the corresponding saving yields are $860 for plan A and $830 for plan B.
- Given that the major assumption in this situation is that no interest is earned on money deposited into the account, I hold the view that the first quadrant of the graph is the only quadrant which is relevant to this problem. This follows due to the fact that the significance of the two saving plans is in the exploitation of the saving plans by the clients, which can only occur practically (in reality), that is in the positive domain rather than the negative one.
Nonetheless, had there been some interest earnings on the money deposited into the account, then the first and the second quadrant would bear a lot of relevance to the situation. Thus, since this is not the case, one can only conclude that the first quadrant is the only quadrant which is relevant to this problem.
Reference List
Pierce, R. (2010). Algebra Menu. Math Is Fun.