Introduction
The future of the retail market lies in online stores. Amazon has been one of the most successful players in this field in the United States. However, this takeover has been reported to have an adverse impact on the company’s profitability (Evans, 2020).
Discussion

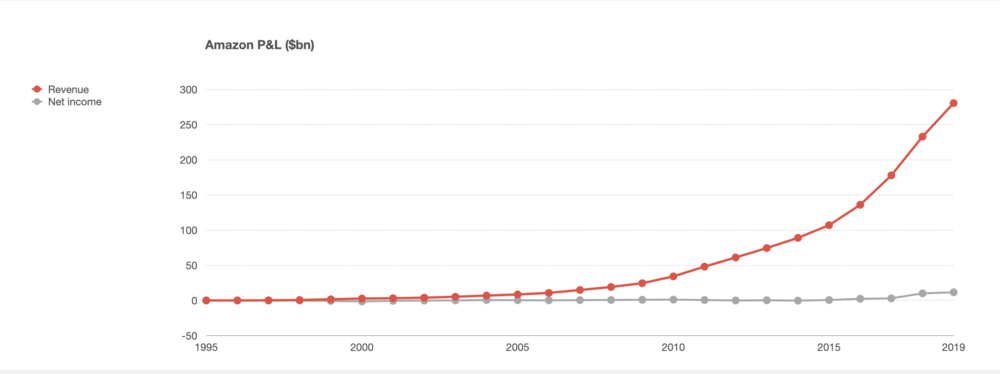
This graph can be interpreted as a lack of growth, however, it is vital to take a closer look at the situation. Evans (2020) states that “the sales keep going up, and it takes a larger and larger share of US retail every year (7-8% in 2019), but it never seems to make any money.” Kim and Su (2019) state that “Amazon was known for running laser-thin margins because it reinvests most of its money back into the company’s growth.” In 2018-19, Amazon reported a net income of $22 billion, with only a slight decrease in reinvestments (Evans, 2020). Therefore, the perceived lack of profitability is related to the figure itself and not the company’s situation.

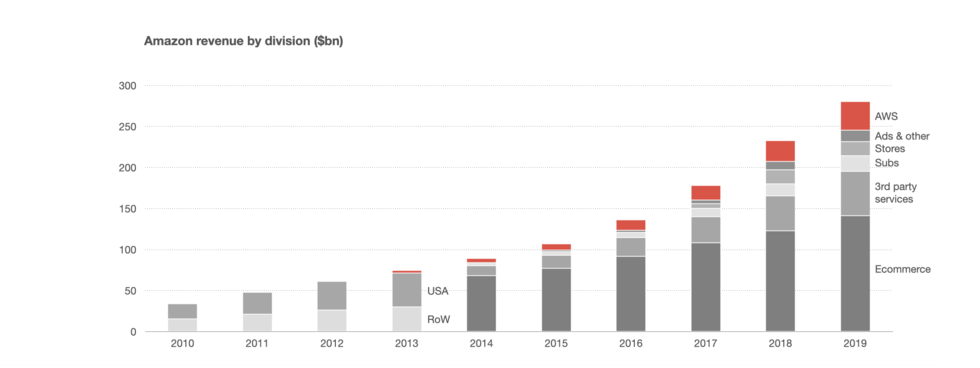
The second chart puts the shares of each division for comparison. This business goes far beyond retail stores, as many other projects of Amazon, such as AWS, are highly successful on the market (Evans, 2020). The share of online sales has been growing extremely fast in the past few months due to coronavirus lockdown (Davis, 2020). According to Davis (2020), “online grocery sales that tripled year over year powered Amazon.com Inc. to a 43.4% increase in second quarter sales in North America and 33.5% growth worldwide.” Seeing that a high percentage of all revenue comes from e-commerce, it is safe to describe Amazon’s current strategy as highly successful due to the flexibility and accessibility of its products.
Conclusion
Amazon, Inc., reported increased revenue in the second quarter, from $81.56 billion expected to $88.91 billion (Palmer, 2020). The online retail store continues to grow even during the current decline in businesses’ revenues across the globe. The massive scale of its divisions requires a thorough examination for a proper resource allocation.
In conclusion, online retail stores are nearly impervious to the effects of pandemics and other events with an adverse impact on sales. The measures that were taken by the company allowed it to respond to the situation, react to the sudden spike in demand, and increase the volume of sales (Palmer, 2020). It is vital to continue this trend and keep a closer look at the profitability of services in relation to their size. This analysis allows the company to decide on the most vulnerable and essential sources of income.
References
Evans, B. (2020). Amazon’s profits, AWS and advertising. Web.
Kim, E., & Su, R. (2019). 25 charts that show Amazon’s explosive growth over the past decade. Business Insider. Web.
Palmer, A. (2020). Amazon sales soar as pandemic fuels online shopping. CNBC. Web.
Pei, A. (2019). Amazon charts show one crucial technical indicator to watch for the stock, says strategist. CNBC. Web.