Abstract
This study has been carried out to enhance the comparison between two field tests; the vertical jump test and the Wingate lab gauge of anaerobic power. This experiment was conducted using twenty students; (15 of the students were males and 5 were females; mean +/- SD age, 21.6 +/- 4.43). The field test had to do with a 15-second anaerobic jump test to evaluate anaerobic power. The stair sprint test was carried out with the aid of a timing gate and the vertex was employed in the vertical jump test; both of which were performed tries.
Also, to find the peak power, and the values for the mean power and the index of exhaustion or fatigue, all the students that took part in the experiment or study were subjected to a 30-second Wingate anaerobic test. This was performed with the aid of a Monark cycle ergometer. In the two tests that were conducted, statistically significant peak power figures were observed in males, but none was noticed in females. In this study the findings are indicative that the entire three tests performed, anaerobic characteristics have been measured. The Wingate test and the field test all evaluate unique aspects of anaerobic ability and power. The Vertical jumping test, after a critical consideration, was found to be inappropriate for individuals that are not skilled in jumping.
Introduction
Methods used in the evaluation of the performance of sportsmen and women are being sorted for by their trainers. The performance of athletes in the past couple of decades has improved significantly as a result of improvements in the training techniques. A growing interest has also been observed in the determination of anaerobic capacity. The correct evaluation of anaerobic power is essential for athletes; this is because most sporting activities have to do with a changeover from a hurried break to high-intensity exercise. Examples of such exercises are running and jumping.
When the degree to which an exercise is to be performed is low, the system used is the aerobic system; it is the main source of re-formed ATP that is required for the activity to continue. To maintain activities that require more work to be done, an anaerobic energy system is needed. The energy needed for exercise in the first two minutes is provided by the instant and the short-term energy systems. Due to the fact, the two systems do not require air, because of the chemical energy that is already stored that is utilised to produce muscle tightening. They are anaerobically operated. It is normally observed that, that activities that require a fast pace or resistance to motion at a given speed tend to depend solely on the transfer of anaerobic energy.

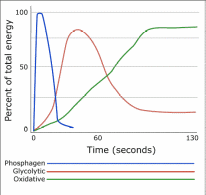
Figure 1 shows exercises performed at various periods of time and the input of various energy systems (both aerobic and anaerobic). At the start of different forms of movements, either slow or high-speed movements, the intramuscular phosphagens, (ATP) and PCr systems make available energy for the action of muscles. After the exercise to be carried out has been performed for some minutes the glycolytic energy system supplies most of the energy that is required for the remainder of the exercise. For the exercise to be carried out for some time but at a lower level, the intramuscular phosphagen re-synthesis is required, as a result of this demand is steadily placed on the aerobic metabolic pathway.
Some activities solely rely on a single system, while others make use of more than one energy system. Nakamura, (1985), Stated that “……..for higher, short intense durations will call for greater demand on the anaerobic energy system”. A test to determine the performance that is dependent on the optimum activation of the ATP-PCr reserves is currently developed and referred to as a practical field test. It is used to assess the instant energy transmitting system. Power test is the name that is used to refer to optimum effort performance, for the assessment of the rate at which work is done. (i.e., power is defined as the rate at which work is been done)
Anaerobic Power Tests
The ability of an individual to generate power from ATP is determined after a few seconds of an all-out exercise or performance. Some examples of the anaerobic test of power are bicycle riding, fast-paced running, and other simulated forms of exercise. e.g. running, and skiing. The test for power might be used as a means of expressing alterations in the performance of an athlete who has undergone some specific form of training.
When the test is carried out, it is used as an avenue for self-assessment and encouragement. And it is expected to some extent to evaluate the actual movement being tested in the course of the activity. For example, the 40-yard dash is employed by the majority of sporting clubs in evaluating the speed of individual players. Since different forms of speed tests have a need for evaluation in football, the result obtained from the 40-yard test is not actually suitable for a player’s evaluation. A speed test that is short and requires an alteration in the direction of movement on a regular basis will be a more suitable means of player speed evaluation. (Hoffman, et al, 2000) suggested that
“Several physiologic and biochemical measures, in addition to exercise performance, can estimate the energy-generating capacity of the immediate energy system, which include: Size of the intramuscular ATP-PCr pool, ATP and PCr depletion rates from all-out exercise of short duration, magnitude of the oxygen deficit calculated from the oxygen uptake curve, magnitude of the alactic (fast component) portion of recovery oxygen uptake”.
Taking into consideration all the measures, an approach that is very straight to the point, has to do with the rate at which ATP is used up; this also has a relationship with instant energy system performance estimates. But in reality, it is very hard to determine the exact intramuscular biochemical values in the course of an exercise that is to be performed for a very short time period. Consequently, we just have to depend on these values collected in short time durations, to enable the determination of an individual’s ability for ATP-PCr energy transfer
Short-Term Energy System Evaluation
As indicated in the figure above, when an exercise is performed by an individual for more than a few seconds, the input of glycolysis is increased i.e. the contribution of the short-term energy system to the overall energy production. This is not an indication that aerobic metabolism is not a factor to be considered at this level of the exercise, or that the reactions that have a need for oxygen are yet to be turned on.
From the figure above, it can be deduced that the aerobic energy system commences its input to the overall energy that is produced at an early stage in the exercise. However, the energy that is needed for an all-out exercise considerably exceeds the amount of energy that is created by the oxidation of hydrogen (Siri, 1956). This shows that the anaerobic effect of glycolysis overshadows, with a large amount of lactic acid gathering inside the muscle that is been used actively and, in the end, showing up as lactate in the blood vessels. There are no criteria available to show when an individual has assumed the highest anaerobic effort.
An individual’s motivational level, and external factors to the environment that is under test inclusive may have an effect on the test of one’s performance. Nevertheless, blood lactate is employed by researchers to show the level of establishment of the short-term energy system. Performances that need considerable activation of short-term energy systems have a need for maximal work for a time period not less than two minutes. All out-bicycle riding is used in caring out short-term energy system examination, in recent time weight lifting has been added to the list of the activities used in the performance of the short-term energy test.

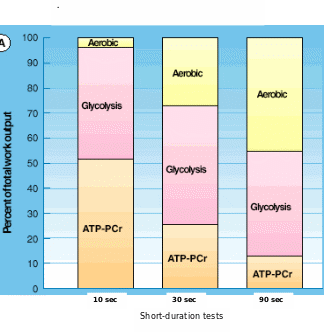
Figure 2, shows the individual inputs of each of the metabolic pathways, in the course of three distinct times of all-out cycle ergometer test. The result has been presented as a percentage of the overall work produced or performed. A constant change in percentage input of the individual energy systems to the overall work produced as the time of effort advance can be noticed from the figure.
The Wingate cycle ergometry test is employed to determine continued muscle strength. As a result of the absence of the eccentric phase, the test is inhibited by the absence of progress and recovery of elastic energy. According to Skinner (1996), “the Wingate test is controlled by concentric actions of the low extremity muscles and 30-second duration can assess short-term fatigue on power production. However, the Margaria test and the vertical jump tests do not last for 2-3 component seconds”.
Factors Affecting Anaerobic Performance Tests
Training
On a general note, effective performance in activities that put great demand on the anaerobic energy system has a link with higher degrees of blood lactate after optimum effort. For example, the performance of activity says the riding of a bicycle or bicycle ergometer in athletes that are well-skilled, result in the generation of an enhanced concentration of blood and an accompanying acid in those athletes that are not trained. This finding is used as a confirmation of what is held as a general belief that, undergoing some form of training at least for a short period of time increases the glycolytic system’s ability to produce energy.
Buffering of Acid Metabolites
When the rate at which glycolic energy is transferred dominates, there is a collection of lactic acid. This results in a reasonable change in the acidity of the muscle having an impact on the intracellular environment, that is not positive. For instance, reduced intracellular PH impacts negatively on the contractile ability of the muscles, that are actively involved in the activity.
The toxic intracellular changes during anaerobic performances have made many believe that some form of anaerobic training might improve short-term energy ability by stepping up the body’s buffering reserve to enhance higher or more lactic acid generation in the course of an effective buffering. Nevertheless, only a minute change in the alkaline reserve has been observed in athletes, when compared to inactive persons. Thus, it can be generally concluded that the buffering ability in both skilled or trained and untrained persons is actually the same (Patterson and Peterson, 2004).
Motivation
It is observed that individuals with very high stamina tend to achieve more anaerobic work. For example, individuals with great pain absorbing ability (Siri, 1956). A higher degree of blood lactate is produced by these individuals, at the same time, there is an increased reduction in the glycogen level. The average score of individuals with a high degree of tolerance for short-term energy ability is high. Irrespective of the fact motivation is hard to place when it comes to motivation; it is an important factor that cannot be overlooked when it comes to high performances in competitions (Mannion, 1986).
Methods
The Wingate Test
The device that is used for testing in the Wingate test is the braked Monark cycle Ergomedic 874E. Within a couple of seconds, a constant opposition is added to the flywheel; the subject goes on with the cycling for about thirty seconds. Specially designed Wingate software is utilised in taking the revolution of the flywheel after every five minutes. The power produced is observed at the lowest and highest points.

The Stair-Sprinting Test
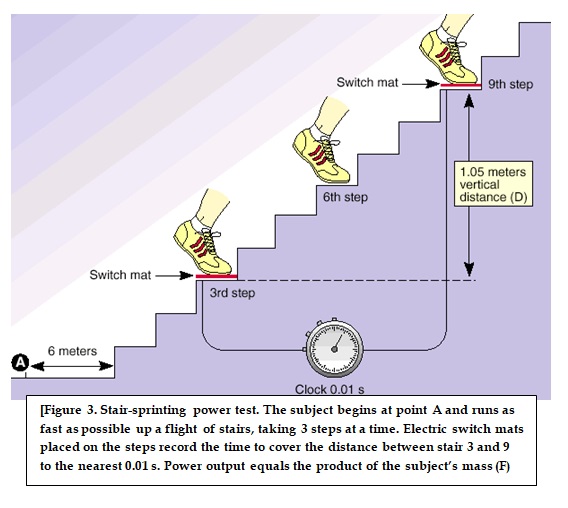
In performing the stair sprinting test, the individual or subject used in performing the test is made to stand a distance of about six meters directly in front of the staircase. At the command of the person making the observation, the subject starts moving up the stairs as fast as possible, ensuring that at least three steps are taken at a given time (Maughan et al, 1966). A stopwatch is used in the timing of the subject; as the subject climbs the third step the stopwatch is powered and the stopwatch is switched off as the person sets his feet on the ninth step. The stopwatch is connected to a digital timer, which records the time in milliseconds. A total of three reading is taken and the average of the final readings usually the last two, are used in the computation of results.
Table 1. Normative Data for The Margaria-Kalamen Stair-Sprinting Test.
The Vertec Vertical Jump Test
The height of the individual been considered is taken, as he positions himself under the vertec, with one of his hands extended upwards. When a command is given by the monitor the person jumps up as far as he or she can go, using every part of his body to enhance his upward movement (Sands.et al, 2006). The vane is dropped down to a low level, usually to the point where the arm stops when stretched to the fullest with all the feet on the ground, then the measurement of the height attained during the jump is taken by vane that is reached, normally the highest.
Results
The data of the subjects and the results of the field test are presented in the table of characteristics and field test. Difference (p< 0.01) was taken between the subject’s height and wieght2. (176.7+/-9.76 Vs 72.7+/-13.94). A linear correlation or relationship is presented in the matrix table. Significant relationships were observed between the sprint stair test and the Wingate test having peak power values (r=1.97×10^-5, p<0.01); R^2=70%). The Vertical jump test was observed to be correlated with Wingate test PPO(r=8.11×10^-7), P<0.01; R^2=53%).
Table 2. Results of the Lab and Field Tests of Subjects.
Table 3. The Characteristics and Field Test of Subjects.
Table 4. Correlation Matrix of Variables.
Discussion
The standard deviation of the sprint stairs (42.75+/-8.22) and vertical jump test, (47.23+/-10.37) was found to be less when compared to Wingate tests both for the min and peak power. This implies that the samples of the field test, (sprint stairs and vertical jump test are fewer variables as compared to the Wingate test. Differences (p<0.01) were taken between the subject’s height and weight (176.7+/-9.76 vs. 72.7+/-13.94). The results obtained from this evaluation are indicative that there was a slight increase in the peak power output (p< 0.01), when the values were determined using the gender of the subjects (Male and Females).
The sprint test in this experiment had to do with the components of agility, that is to say, a change in the direction the subjects moved, obviously have an impact on the findings. This study has established that there is a relationship that exists between all the field tests that were performed at a high intensity (p < 0.01). The jump test in both the males, females, and various heights and weights were interrelated, suggesting that all the tests carried out used similar power components. The sprint stairs and vertical jump test (p< 0.01) relate with sprinting capability, this is indicative that they can be utilised in place of another in taking measurements of anaerobic performance.
Conclusion
The findings in this study indicate that the two test procedures can be used in the determination of running and jumping ability. In the two tests that were conducted, statistically significant peak power figures were observed in males, but none was noticed in females. In this study the findings are indicative that the entire three tests performed, anaerobic characteristics have been measured. The Wingate test and the field test all evaluate unique aspects of anaerobic ability and power.
References List
Hoffman, J.R., Epstein, Shmuel; Einbinder, Merav, Weinstein, Yitzah. 2000. A Comparison between Wingate Anaerobic power test to both vertical jump and line drill tests in basketball players. The Journal of Strength & conditioning research. Vol.14 (3), pp.25.
Mannion, A., 1986. Comparison of velocity dependent and time dependent measures of anaerobic work capacity. In Reilly, Watkins and Borms (eds.)Kinanthropometry 111. London: E $ F.N. Spon, pp.301-307.
Maughan RJ, Watson JS, and Weir, J., 1966. Strength and cross sectional area of human skeletal muscle. Journal of applied physiology. Vol. 21:1662-1664.
Nakamura, Y., 1985. Determination of the peak power output during maximal brief pedaling bouts.journal of sports science.Vol.3, pp.181-187.
Patterson, D.D. Peterson, D. F., 2004. Vertical jump and leg power norms for young adults. Measurement in physical education and exercise science. Vol.8 (1) , pp. 33 – 41.
Sands, W.A., McNeal, J.R., Ochi, M.T., Urbanek, T.L., Jemni, M., Stone, M.H., 2004. Comparison of the Wingate and Bosco Anaerobic Tests. Journal of Strength and Conditioning Research. Vol. 18, (4) 810 – 815.
Skinner. S. 1996. The Wingate Anaerobic Test. Leed: Felna.
Siri, W. 1956. Gross composition of the body. New York: NewYork academic press.