About BlackRock World Mining Trust
BlackRock World Mining Trust is a British investment trust. The company was established in 1993 and it deals with investment in mining and metals. The company is a publicly traded entity based in London, United Kingdom. The company is listed on the London Stock Exchange. Besides, it is a component of the FTSE 250 index. The firm’s objective is to maximize the returns of the shareholders through investing in a number of securities of mining and metal securities. It is the largest investment trust company in London.
Valuation of beta
The beta of an asset is commonly used to estimate the price of the asset using the capital asset pricing model. It measures the volatility of a company’s stock relative to the market changes. Computation of asset beta is founded on historical returns which may not give an estimate of the firm’s future share prices. A number of factors can make the value of asset beta to fluctuate. Some of the factors are risk of the business, operation risk, financial risk, and sales risk. Asset beta is the sum of beta equity and beta debt. Beta is calculated using the using the formula shown below.
Bets (β) = Covariance (rs, rb)/Variance (rb)
In the formula above rs – return on the stock of BlackRock World Mining Trust
rb – return on the FTSE 250 index
These are the result of calculations in excel
Covariance (rs, rb) = 0.026683
Variance (rb) = 2.052885
Beta (β) = 0.026683 / 2.052885 = 1.299
Since the value of the beta calculated is less than one (1.299 > 1), it implies that the shares of BlackRock World Mining Trust are more volatile than the FTSE index.
The value of beta reported in the financial statements is 1.50. This indicates that the value of beta reported is greater than the value calculated. Since the value of beta reported is greater than one (1.5 > 1), it implies that the share prices of BlackRock World Mining Trust are more volatile than the FTSE index. Thus, the stock prices fluctuate significantly when FTSE 250 swings up and down. The difference in the values reported can be attributed to a number of reasons.
The first reason is the difference in time period. For instance, the calculation of beta above is based on data collected over a period of five years while on the other hand the beta reported might have been calculated over data for one year, half a year or quarterly. It is worth mentioning that the volatility of prices of assets is not constant. Thus, volatility over a period of one year cannot be the same as the volatility over five years, six months or three months.
The second reason is the composition of companies that makes up the market portfolio that is used for comparison. The use of different composition of the market portfolio also creates the different results. The third reason is the difference in the method of calculation of beta. The final reason is the difference between historical and fundamental beta. The historical beta originates from the historical prices of a stock while fundamental beta originates from statistical model that estimates prices using various sets of data. Thus, the two values can only be similar if data are collected for the same period, the composition of market portfolio is exactly the same, and when the method of computation based on historical data is similar.
Comparison of performance of share for BlackRock World Mining Trust and FTSE 500
The valuation ratios give an indication of the performance of the shares of a company. For instance, the price earnings ratio is obtained as a result of division of market value per share and the earnings per share. A higher value would imply that the shareholders are expecting higher returns in the future. The second ratio is the price to book value. It is obtained by dividing the market value of shares and the book value of the firm. The ratio gives an indication of whether shares of a company are overvalued or undervalued. The other ratios are dividend yield and earnings per share. The presented table below summarizes the performance of the shares of the company and that of the FTSE 250 index.
The table above shows different valuations of the shares of the company and that of the FTSE 250 index. As will be discussed in the next section, the profitability of the company is significantly low and negligibly. The price earnings ratio of the company which was computed indicates the values were extremely low and thus cannot be compared to that of the FTSE 250 index. The price to book ratio of the company was erratic over the five year period. The ratio was affected by the swings in the economy that was caused by the recession. The price to book values of the company were lower than the values of the FTSE 250 index.
Further, the price to sales ratio and price to cash flow ratio for the company were close to zero. Thus, the ratios of the company cannot be compared to that of the industry average. The low valuation of the ratios for the company is mainly attributed to the nature of the industry in which the company operates. Trading in securities does not yield a continuous flow of revenue as in the case of sale of merchandize.

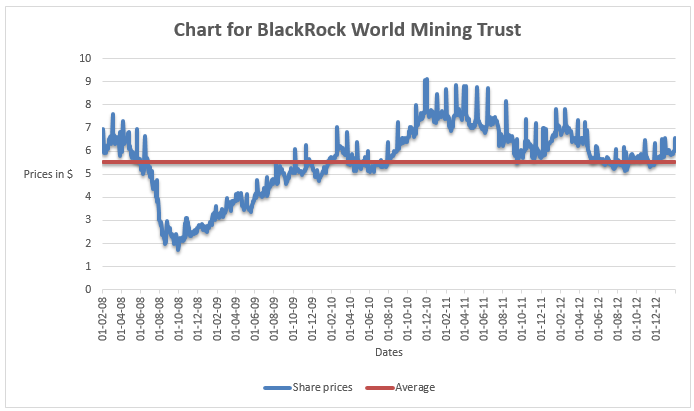
The graph shows that the share prices of the company were erratic over the five year period. In 2009, the share prices declined by a large margin. This can be attributed to the Global economic meltdown that was experienced in late 2009 and early 2010. The share prices were stationary between 2010 and the beginning of 2012. This period the company was recovering from the recession. In 2012, there was an increase in share prices.

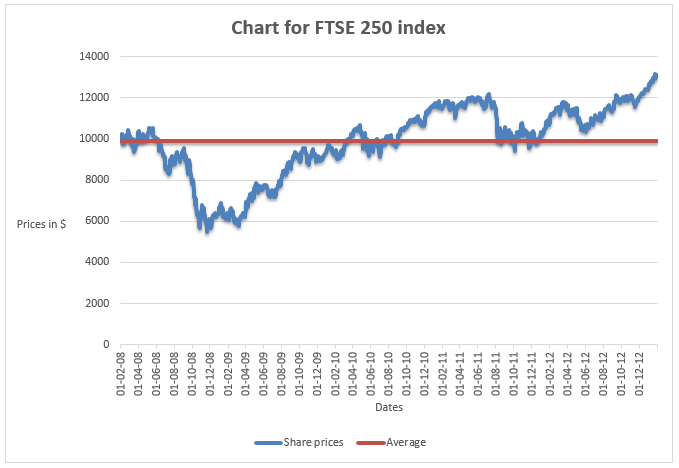
The share prices of the company took almost a similar trend as observed above. There was a decline in share prices in the year 2009. This can be attributed to the Global economic meltdown that was experienced in late 2009 and early 2010. The share prices of the index rose steadily after the recession until 2012 when it experiences a slight decline. Thus, it is clear that the after recession, the company struggled to achieve an increase in the share prices unlike the index which experienced a steady increase in the prices of shares.
Analysis of financial performance of the company
The presented financial statements of the company do not give an in depth analysis of the strengths and weaknesses of the company. Therefore, it is necessary to carry out an in depth analysis of the financial statements so as to have a better view of the company. Ratio analysis breaks down the financial data into various components for better understanding of the financial strengths and weaknesses of the company. The ratios for the company can be broken down into profitability, liquidity, efficiency, and leverage ratios. This section will discuss the trend of the ratios for the five year period, that is, between are 2008 and 2012.
Profitability ratios
Profitability ratios give an indication of the earning capacity of an entity. The ratios measure the effectiveness of a company in meeting the profit objectives both in the long run and short run. The table below shows the profitability ratios of the company.
The gross profit margin, net profit margin and operating profit margin of the company was significantly low and absolutely equal to zero. The company made a large amount of losses that resulted in lower profitability. However, this can be attributed to the nature of the industry and the product and services the company deals with. The profitability ratios of the company were erratic over the years. The strategy employed by the company is not sustainable in the long run. The company should focus on both on increasing the amount of revenue and managing costs.
Debt ratios
A company’s leverage is explained by the amount of debt financing it holds. The ratios are vital since they show the extent of exposure of equity financing. A commonly used ratio is the debt to equity ratio. When analyzing debt ratios, it is important to also evaluate the ability of the organization to pay borrowing cost. The table presented below shows the financial leverage of the company.
There was a general decline in the leverage position of the company. The financial leverage declined from 12.06 in 2009 to 8.30 in 2012. The ratio was higher than the industry average which is 3.01. This implies a decline in the amount of borrowing cost, and an increase in shareholders fund. The amount of debt in the capital structure is quite high. This could account for the negative profit margin. The management needs to reduce the amount of debt in the capital structure. They should endeavour to maintain an optimal capital structure.
Efficiency ratios
Efficiency ratios focus on the internal operations of the company. These ratios show the level of activity in a company. It focuses on efficiency in allocation of resources with an aim of maximizing output and income from the resources available.
The value of efficiency ratios for the company was negligibly low and thus cannot be reported. The value of asset turnover was negative and significantly low. Management of efficiency is of utmost importance since it dictates how the company manages the costs and resources available in the company. It is an indication that the operation of the company is extremely low and thus cannot generate revenue.
Liquidity ratios
Liquidity ratios show the capability of the entity offset current liabilities using liquidity assets. It is necessary to maintain optimal liquidity ratios since either low of very high ratios are not favorable. The table below shows the liquidity ratios of the company.
The liquidity ratios of the company were extremely low over the period. The current ratio ranged between 0.15 and 0.19 in the five year period while the quick ratio was negligibly low. The ratios indicate that the company is experiencing difficulties in paying off current debt using liquid assets. The management of the company needs to work on the liquidity.
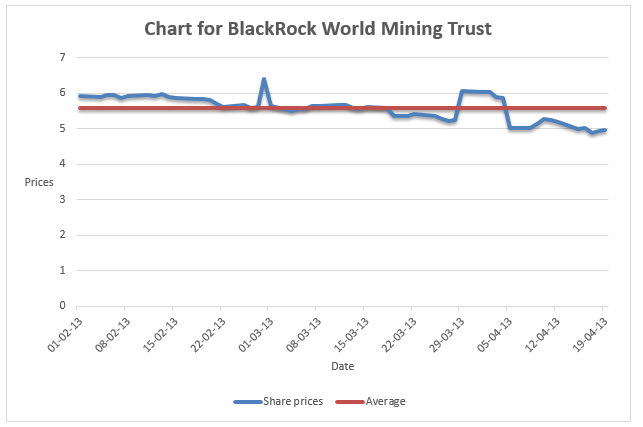
Share prices between 1st February 2013 and 20th April 2013.
The review of the financial position of the company shows that the company is struggling financially. The profitability increased by only a small portion. The efficiency and liquidity of the company were quite low during the five years. The poor financial performance of a company has a direct negative impact on the share prices of the company. This explains the decline in share prices that was experienced between 1st February 2013 and 20th April 2013. The graph below shows the trend of the share prices in that period.
