High School Longitudinal Study dataset was used for the present assignment (mean of X1SES = 0.0545). The dataset includes 68 variables with 5703 observations of different kinds, including nominal, ordinal, and scale variables. Two variables were selected for the analysis, including M1MTHYRS912 and M1HIDEG. The variables were analyzed using appropriate visual representation methods. All the manipulations were made using the SPSS directions provided in the book by Wagner (2019).
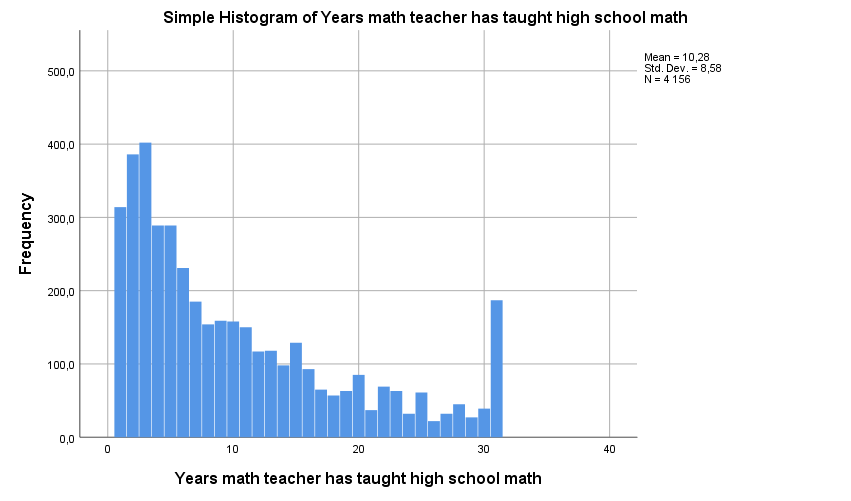
First, M1MTHYRS912 was analyzed using a histogram to understand the distribution of values. M1MTHYRS912 is a continuous variable that shows how many years of experience the math teacher had at the moment of the survey. The histogram is included McClaive et al. (2018) state that one should use a histogram when the data is numeric, and the researcher needs to see the shape of data distribution. This is crucial when determining whether the data is distributed normally. Figure 1 below demonstrates the distribution of M1MTHYRS912. The analysis shows that there are many teachers with more than 30 years of experience. This may mean that a shortage of teachers may be encountered in the nearest future, as these teachers may retire.

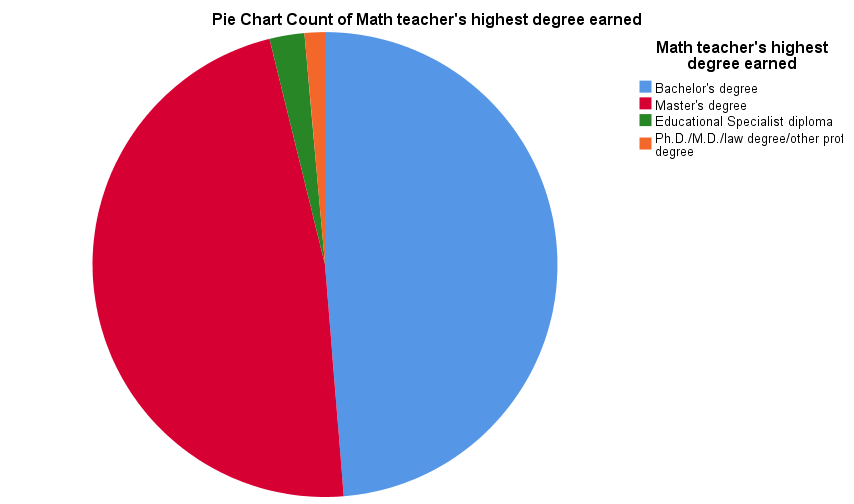
Second, M1HIDEG was analyzed using a pie chart. M1HIDEG is a categorical variable that demonstrates the highest degree of the math teacher. The pie charts are usually used on categorical variables to understand the composition of something (Smith, 2018). In this case, the pie chart in Figure 2 below demonstrates the composition of the sample of teachers according to their highest degree. The analysis demonstrated that the number of teachers with a Bachelor’s degree is comparable to the number of teachers with a Master’s degree. Teachers from these two categories include more than 90% of the sample. The pie chart also shows that the number of teachers with professional degrees or PhDs is low in comparison with the two major categories. Thus, it may be appropriate to increase the of teachers with these degrees.

References
McClaive, J., Benson, G., & Sincich. (2018). Statistics for business and economics. Pearson.
Smith, M. (2018). Statistical analysis handbook. The Winchelsea Press
Wagner, W. (2019). Using IBM® SPSS® statistics for research methods and social science statistics (7th ed.). SAGE Publications.