Background
Argentina is located in South America. Based on the area occupied by the country, it is the eighth largest state in the world. The country has a variety of terrain, such as tall mountains, deserts and striking waterfalls. It is divided into six main regions, which are Tierra Del Fuego, Patagonia and the Lake District, the Pampas, the Chaco, Mesopotamia and the Northeast, and Cuyo and the Andean Northwest. It boarders Chile, Bolivia, Paraguay, Brazil, and Uruguay and other lands.
As at 2010, the country had a population totaling to 40,091,359. The pillars of the economic growth of the country are export-oriented agricultural sector, well-educated population and rich natural resources. The manufacturing sector of the country is also well-developed. The main sectors are motor vehicles and food processing (Embassy of Argentina in Australia 1).
Economic history of Argentina
There are a lot of literature on the economic history of Argentina because instead of having experienced robust economic growth in the 20th century, the country had a low economic growth. The condition is commonly known as ‘Argentine paradox’. The country has a comparative advantage in agriculture since it has rich fertile land. During the period lasting from 1860 to 1930, the fertile land had been highly exploited by the Spanish conquerors.
There was no clear economic system in Argentina during that period. In fact, the Spanish conquerors made use of the land for their own benefit. Despite acquiring the land against the will of the natives, the foreigners ensured that the proceeds from agriculture were used for the development of the country. During the same period, the country was experiencing robust economic growth and it performed better than other countries, such as Australia. The economy of the country started to decline in 1930.
This was attributed to the great depression and political instability. Between that year and 1970, the reigning leaders strived to attain self-sufficiency in industrial production. They implemented certain strategies such as import substitution. The aim of this strategy was to minimize the amount of money the country spends on importation of industrial product. The strategy led to the creation of some employment opportunities.
On the other hand, it resulted in a reduction of agricultural production. Since agricultural production forms the main component of GDP of the country, the strategy created a number of negative effects such as hyper-inflation, privatization, high unemployment rate, devaluation of Peso, and a large amount of foreign debt. The economy recovered in 2005 (The Central Intelligence Agency 1; International Monetary Fund 1; The World Bank Group 1).
Aim of the paper
The data exercise entails collecting and analyzing data for Argentina. The data analysis is carried out for a period of twenty three years that is between 1980 and 2012. Some of the data collected and analyzed are real GDP, inflation rate, and unemployment rate. Policy analysis is carried out on various issues noted during data analysis.
Overview of macroeconomic variables
Gross domestic product
The gross domestic product is a useful indicator of the status of the economy of a country. Measuring GDP is a challenge for economists in all the countries because it is often difficult to quantify all the economic activities in the region. When analyzing the GDP of a country, it is important to distinguish between nominal and real GDP. Real GDP eliminates the effect of inflation. This section will analyze the real GDP of the country for the period of twenty three years.
Source of data – International Monetary Fund 1; The World Bank Group 1
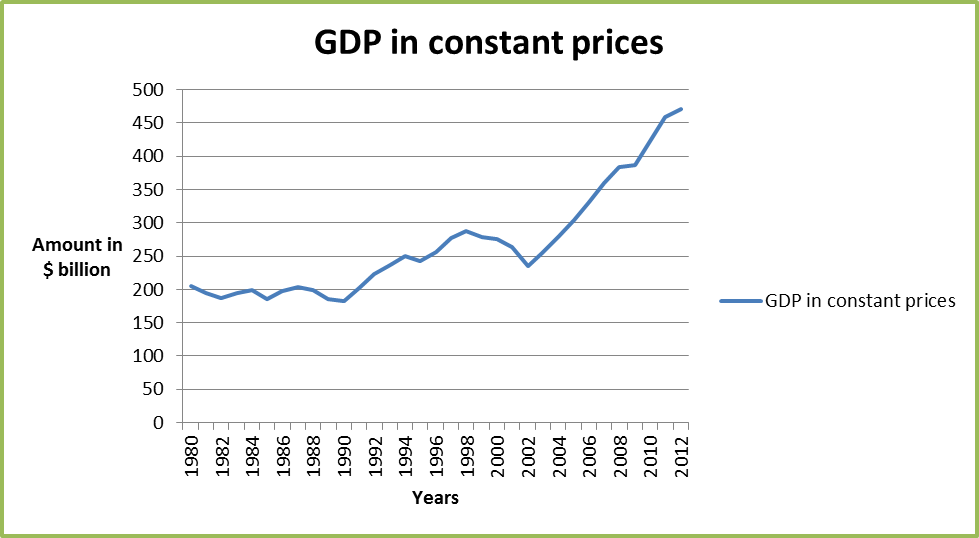
The GDP of Argentina is erratic. According to the table presented above, the GDP amounted to $205.646 billion in 1980. Its value then declined to $193.834 billion. Between 1980 and 1991, the value of GDP was quite erratic. This was attributed to political instability in the country that was caused by the invasion by foreigners and lack of political structures. Between 1991 and 2012, the country experienced steady growth in the value of real GDP.
The GDP increased from $201.819 billion in 1991 to $471.449 billion in 2012. The increase in GDP was as a result of implementation of policies such as import substitution and setting up structures in the government. The graph below shows the trend of the GDP for the past twenty three years (International Monetary Fund 1; The World Bank Group 1).

Consumer price index (CPI)
Inflation rate is a measure of the general rise in the price level in the economy. It is a significant measure since inflation has an impact on the purchasing power of individuals and all other macroeconomic variables. The CPI measures the price level of all new goods produced in the home country. An increase in the value of the CPI from one year to the other shows that there is an increased inflation.
Source of data – International Monetary Fund 1; The World Bank Group 1
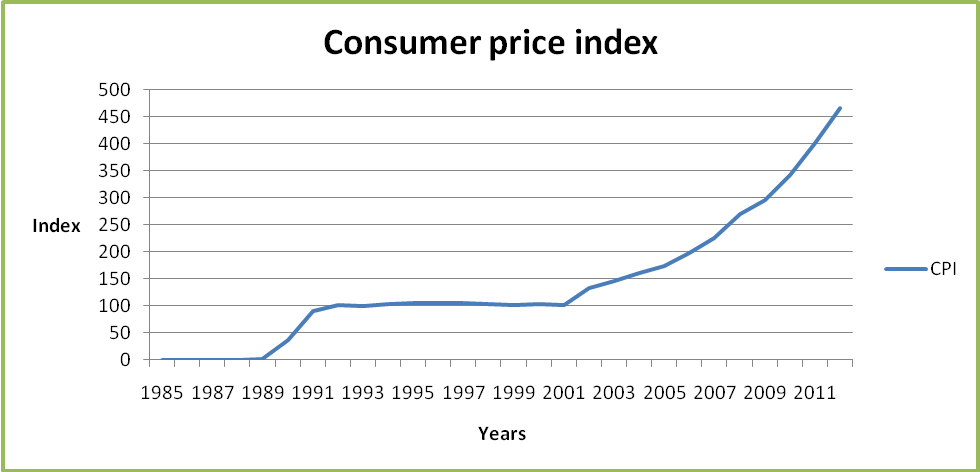
The value of the CPI has been increasing over the years. The consumer price index in 1985 was 0.003. The value increased to $109.982 in 2000 and further to $465.674 in 2012. This shows a rise in the rate of inflation in the country. This has serious economic implication on the key players in the economy that are the households and the firms in the country.
The stability in the rate of inflation between 1989 and 2000 was as a result of a change of government from the Spanish conquerors to the natives. The persistent increase in the amount of the CPI index between 2001 and 2012 was as a result of implementation of strategies such as import substitution and privatization. These strategies distorted the currency of the country thus leading to inflation.

The graph above shows that the rate of inflation since 2001 has been increasing at an increasing rate. It is an economic issue that should be addressed.
Unemployment
Unemployment rate measures the number of people in a country who are not engaged in an economically productive activity even though they are willing and able to work.
Source of data – International Monetary Fund 1; The World Bank Group 1
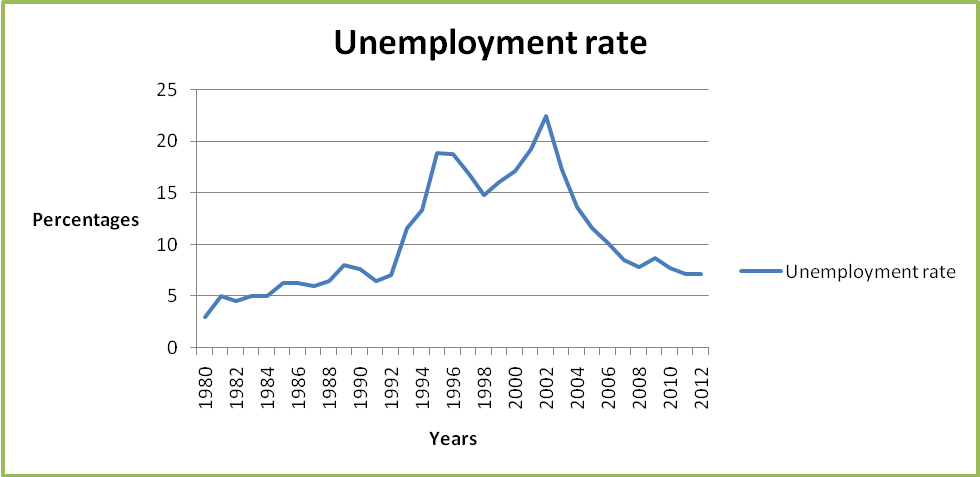
The unemployment rate of the country increased from 3% in 1980 to 22.45% in 2002 as a result of political instability that was caused by the Spanish conquerors. The maximum unemployment rate for the country was attained in 2002. After the year 2002, the government instituted a number of measures to curb the unemployment in the region. From 2003, the country has experienced drastic decline in the unemployment rate.
The value declined from 17.25% in 2003 to 7.169% in 2012. Through import substitution, the government instituted a number of industries. This led to a considerable decline in unemployment rate that was experienced in that period. The graph below shows the erratic trend of the employment rate for the past twenty three years.

Macroeconomic analysis of the economy
The discussion above reveals that the government has been able to manage the GDP and the unemployment rate. There has been a significant increase in the real GDP growth for the past ten years.
Similarly, the government also controlled the unemployment rates as there has been a significant decline in the recent past. Despite the world recession experienced in 2009, the country still reported improved performance in increasing the amount of the GDP and reducing the employment rates. On the contrary, it is clear that the country has a problem in managing the inflation rates.
As indicated by the consumer price index, the inflation rate of Argentina has increased at a high rate in the recent past. As mentioned above, the high inflation rates weaken the economy since it distorts the interest rates, exchange rate, money demand, money supply, and foreign trade. Besides, it affects the consumer’s consumption pattern. High inflation rates also make investors and households lose confidence in the institutions’ set up by the government to control inflation.
Policy recommendations
There are policies that can be put in place to mitigate the increasing inflation rates. A number of both the contractionary fiscal and the monetary policies can be used to control inflation. Some of the fiscal policies entail reducing disposable income by increasing direct taxes, reducing government taxes as well as the amount of government borrowing.
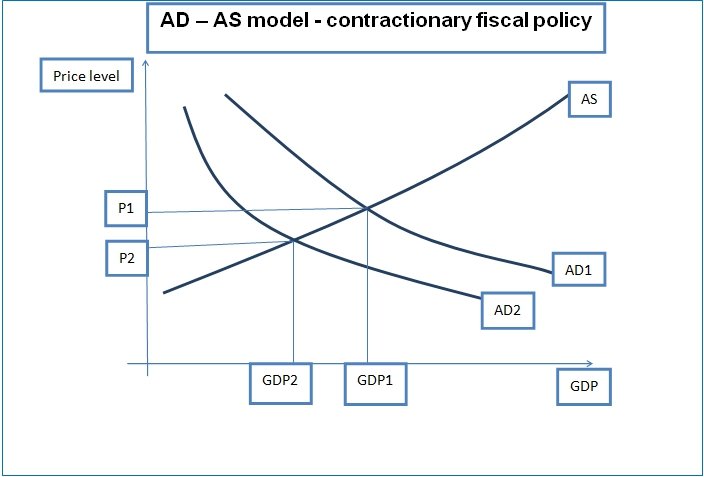
The fiscal policies implemented will reduce the aggregate demand in the economy. In the AD – AS model, the aggregate demand curve will shift inwards as a result of the policies implemented. This causes the price level to decline, hence resulting in a reduction in the rate of inflation. The aggregate supply curve will not be affected. The impact on the AD – AS model is illustrated below.
Contractionary fiscal policies shift the AD curve from AD1 to AD2. This results in a decline in price level from P1 to P2. The GDP also declines from GDP1 to GDP2.

AD – AS model – contractionary fiscal policy
Apart from the fiscal policy, the government can also put in place monetary policies, such as raising the level of interest rate to mitigate inflation. An example of such a policy is increasing the interest rate. This will reduce the amount of money in circulation since high interest rates attract savings and investment.
So consumers will turn away from consumption and focus on investment. Similarly, the government can also carry out market operation by selling securities to the public. This will mop out excess money in circulation in the economy, thus making prices fall down.
Conclusion
The paper carried out a data analysis of Argentina. The exercise entailed collecting and analyzing data for Argentina. The data analysis was carried out for a period of twenty three years that is between 1980 and 2012. Some of the data collected and analyzed are real GDP, inflation rate, and unemployment rate. Policy analysis is carried out on various issues noted during data analysis. The discussion above shows that the economy of Argentina is vibrant and has a bright future ahead.
It is for the reason that the country has a rich export-oriented agricultural sector, well-educated population, and rich natural resources. The manufacturing sector of the country is also well-developed. Thus, there is potential for a growth disaster. However, there are a number of issues that need to be resolved to facilitate the robust economic growth. First, the leaders of the country need to put in place well organized government structures. Also, the government should enhance political stability in the country.
This will restore the confidence of the investors. Thirdly, the government also needs to control and reduce the inflation rates. It is a key economic issue noted in the discussion above. In as much as the contractionary macroeconomic measures above might lead to slow economic growth, it is necessary to implement them as soon as possible. This will create a bright future for economic growth of the country.
Besides, it will also restore investors’ confidence in the country. Finally, the government should come up with and implement strategies that will not worsen the current rate of inflation. Thus, it is necessary for the government to carry out a comprehensive evaluation of the economic status of the country so as to come up with policies and strategies that will spark a healthy economic growth of the country.
Works Cited
Embassy of Argentina in Australia 2013, Argentina in Brief. Web.
International Monetary Fund 2012, Data and Statistics. Web.
The Central Intelligence Agency 2013, The World Fact Book. Web.
The World Bank Group 2013, Data. Web.