The present report summarizes proceedings and findings of a data set analysis containing test and quiz scores of different groups of people. The paper aims at providing descriptive and inferential statistics concisely and comprehensively. To achieve the set goal, the report presents the results of statistical tests performed in StatCrunch together with a discussion of the results. The paper assumes that all the groups took the same tests, and all the gaps in the data set are treated as students not taking tests.
Part A: Descriptive Statistics
Sample Description
The sample under analysis contains test results and quiz results for 44 students. The students are differentiated by sex and sections (A and B). The data set also includes aggregated information about weighted average scores for all students, assuming that test results are 65% of the grade, and quiz results are 35% of the final grade. The data also includes average test results and quiz results for all students.
Descriptive statistics represented in Figure 1 demonstrates that the mean score of tests in quizzes decreases with every test, while standard deviation (SD) grows. This may mean that students start education with comparatively similar skills and knowledge. SD grows because students learn at a different pace, and the mean score goes down as tests and quizzes become more complicated.

Section A
Section A has 22 students that took the same three tests and quizzes. The descriptive statistics for the group are summarized in Figure 2. According to aggregated data, the average test results are 73.42, and the average quiz results are 73.68. Considering confidence interval (CI), one can be 90% certain that the mean for test results lies between 68.6 and 78.24, while the mean for quiz results lies between 68.07 and 79.29. Fluctuations within the confidence interval are considered statistically insignificant. CI was calculated using a one-sample t-test in StatCrunch, and Figure 3 demonstrates the results of the analysis. In summary, according to observation, Section A results follow the pattern of the sample with no significant differences in descriptive statistics.


Section B
Section B also consists of 22 students that took the same tests as students in Section A. The descriptive statistics for the group are summarized in Figure 4. The mean for average test and quiz results with regards to CI=90% are represented in Figure 5. The data demonstrates that one can 90% sure that the mean for test results lies between 69.42 and 80.41, while the mean for quiz results lies between 72.62 and 82.48. According to observations, there are considerable differences in means of test and quiz results. The statistical significance of these differences will be tested in the following sections.


Males
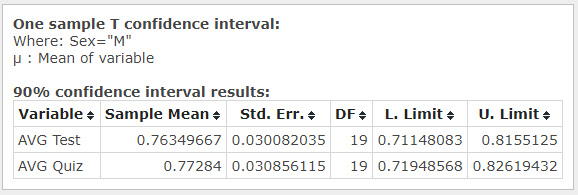
The sample includes 20 male students, which took the same tests and quizzes. The analysis results of student activities are represented in Figure 6. The average test results for males (CI=90%) lie between 71.15 and 81.55, while average quiz results for the group are between 71.45 and 82.62. The confidence interval was computed using a one-sample t confidence interval in StatCrunch. Its results are demonstrated in Figure 7.


Females
There are 24 female students in the sample, which took the same tests and quizzes as females. The descriptive statics for females is summarized in Figure 8, while the results for one sample t CI are demonstrated in Figure 9. According to the test, average test results are between 67.32 and 77.38, while the mean for quiz results lies between 68.99 and 79.45. According to observation, there are considerable differences in scores. Their statistical significance will be tested in the following sections.


Part B: Inferential Statistics
Differences between Males and Females
To understand if there are statistically significant differences in test and quiz scores, two-sample t-tests were performed assuming equal variances. A total of eight tests were run to compare the performance of female and male students. The hypothesis was that the means are not equal, while the null hypothesis was that the means were equal (H0: μ1 – μ2 = 0; HA: μ1 – μ2 ≠ 0). The results revealed no statistically significant differences in the performance of males and females on tests and quizzes (alpha=0.90).
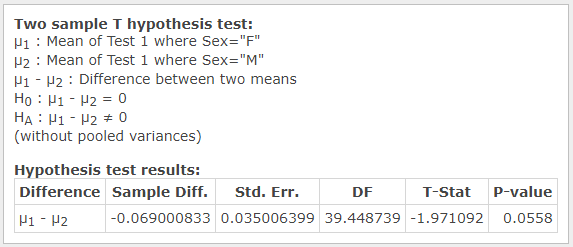
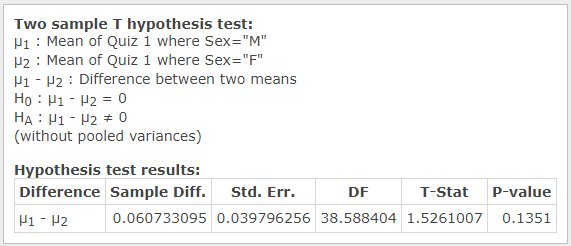
However, the analysis of females’ scores against males’ scores revealed that there is a 94.4% probability that males have higher scores on the first test (see Figure 10). Moreover, the difference between scores of the groups almost reached statistical significance for the results of the first quiz with p=0.1351 (see Figure 11). In other words, it may be concluded that females’ performance is worse in the beginning. However, the difference disappears as the semester continues.


Differences between Section A and Section B
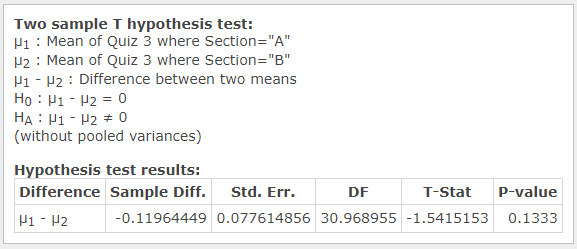
The same test was used to identify if there are statistically significant differences in performance between Section A and Section B students. Eight two-sample t-revealed no statistically significant differences in test and quiz scores. Even though the difference in scores for Quiz 3 almost reached the statistical significance of alpha = 0.90 (see Figure 12), the finding is irrelevant, and no conclusions can be drawn from it. The absence of differences suggests that the educator of the two groups uses reliable teaching techniques, which can produce consistent learner outcomes.

An additional test was designed to confirm the supposition. It measured statistically significant differences in the proportion of students in Section A and Section B who have less than a 70% average. Another column (called “Below 70?”) was created, which marked students with scores below 70% as “yes” and students with 70% and above as “no.” After that, a two-sample proportion hypothesis test was used to prove the supposition (see Figure 13). The results show that there is no statistically significant difference in the proportion.

Summary of Findings
Descriptive and inferential statistics of the data set revealed that, on average, eight out of 22 students have final grades higher than 70%. Test and quiz scores are lower and more diversified later in the semester, which may be connected to the fact that material becomes more complicated, and students learn at a different pace. The comparative analysis of females’ performance against males’ performance revealed that females have lower scores on the first test than males do. At the same time, the analysis of scores demonstrated no statistically significant differences between Section A and Section B students.