Data File Description
Variables used in this report are gender, a string variable whose measurement level is nominal, and gpa, total and final which are numeric variables whose measurement levels are scale (de Leeuw, 1997). The type of correlation for gender paired to either gpa, total or final is point biserial (rpb) correlation while the type of correlation for gpa, total and final paired to each other is Pearson’s r. The sample size (N) = 105.
Testing Assumptions
The assumptions of correlation for gpa and final:
- Final and GPA variables are independent.
- Final and GPA quantitative and each variable is normally distributed.
- Final and GPA scores are linearly related.
- Final and GPA scores do not have extreme bivariate outliers that influence the magnitude of the correlation.
- Variability in GPA scores is uniform across levels of Final.
.


Descriptive Statistics
Table 1: Descriptive Statistics for final and gpa.
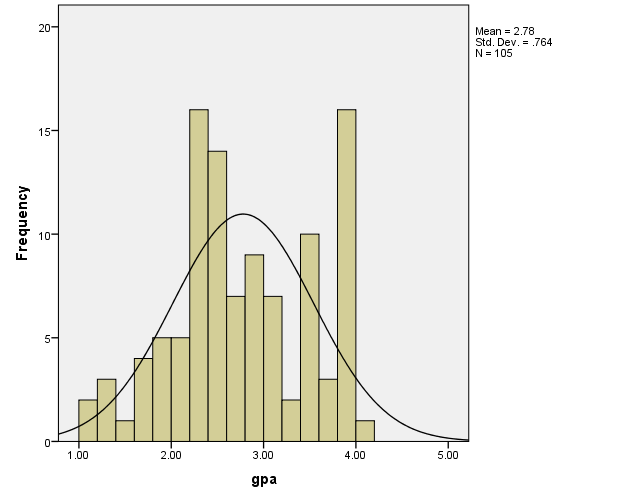
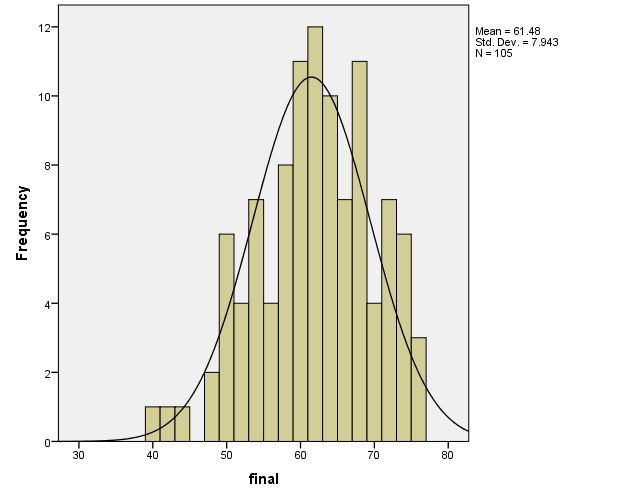
Both variables final and gpa have negative skewness which indicates that they have tails extending towards the left (Warner, 2008). However, final is more skewed to the left than the gpa.
Both variables have negative kurtosis indicating low peaks. However, final has a higher peak than gpa which has higher kurtosis value which means that it is more non-normal.
Scatter plot output

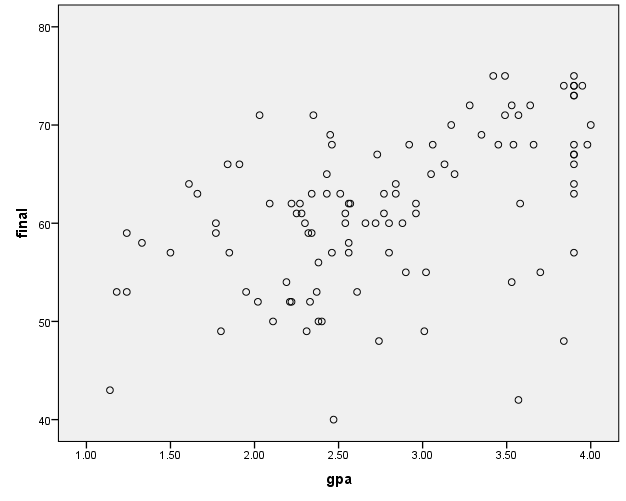
The scores are well spread in this scatter plot. There seems to be an association as higher gpa scores are associated with most final scores and vice versa. This indicates that there is a positive correlation between final and gpa (Thomas, 2003).
Research Question, Hypotheses, and Alpha Level
Research question
Is there a linear association between gpa and final?
Null hypothesis and alternative hypothesis
- H0: rGPA, FINAL = 0.
- H1: rGPA, FINAL ≠ 0.
- Alpha level = 0.05.
Interpretation
Table 2: SPSS output of the intercorrelation matrix for the gpa, gender, final and total. *Correlation is significant at the 0.05 level (2-tailed). **Correlation is significant at the 0.01 level (2-tailed).
The lowest magnitude correlation was recorded between total and gender although this was not statistically significant, rpb (103) = -0.120, p = 0.224 (Tabachnick, Fidell, and Osterlind, 2001). The r2 was 0.0144; thus, only about 1% of the variance in total scores could be predicted from gender scores. This is a very weak negative correlation (Field, 2013).
The highest magnitude correlation was recorded between total and final which was statistically significant, r(103) = +0.883, p < 0.001. The r2 was 0.780; thus, about 78% of the variance in total scores could be predicted from final scores. This is a very strong positive correlation.
The correlation between gpa and final was statistically significant, r (103) = +0.498, p < 0.001. The r2 was 0.248; thus, about 24.8% of the variance in gpa scores could be predicted from final scores. This is a weak positive correlation (Rumsey, 2002).
Conclusion
The lowest magnitude correlation was recorded between total and gender although it was not statistically significant while the highest magnitude correlation was recorded between total and final which was statistically significant. Though histograms, skewness, kurtosis and scatterplots are useful in testing the assumptions for correlation, they are not objective measures. More exact tests should be applied to ascertain the assumption of a normal distribution. Moreover, some of the assumptions set for most statistical tests are never met.
References
de Leeuw, J. (1997). The UCLA statistics textbook and modules. Bulletin of the International Statistical Institute, 51st Session Istanbul 1997, Proceedings Book, 2, 55-58. Web.
Field, A. (2013). Discovering statistics using IBM SPSS statistics. San Francisco, CA: Sage. Web.
Rumsey, D. J. (2002). Statistical literacy as a goal for introductory statistics courses. Journal of Statistics Education, 10(3), 6-13. Web.
Tabachnick, B. G., Fidell, L. S., & Osterlind, S. J. (2001). Using multivariate statistics. New York, NY: Pearson. Web.
Thomas, W. (2003). Publication manual of the American Psychological Association. Nurse Researcher, 10(3), 86-88. Web.
Warner, R. M. (2008). Applied statistics: From bivariate through multivariate techniques. San Francisco, CA: Sage. Web.