Abstract
This report shall rely on a statistical model toll, regression analysis to model what factors have the most impact on the S&P 500. In essence, there shall be two regression models where the model (multivariate regression model) sought to find out how different factors affect the stock market relying on data from 1980 to 2011. The model can be tested for statistical significance, but the most appropriate way to examine the impact of the individual variable impact on the S&P 500 is testing for different beta notes (β, I’s,). SPSS shall be used as the analysis software tool. This report shall provide analysis and clear interpretation of each one of the coefficients contained in the two studied models and give recommendations.
Introduction
Business environments are subject to various contingencies and risk factors that if not mitigated early in advance, may lead to business closure or loss. In this sense, business owners and managers always seek to find ways to find the means to predict future trends and patterns as a way of maximizing Return on Investment. One such pathway is the use of statistical knowledge is where prevailing trends or patterns can be extrapolated to predict how such trends would unfold in the future.
The US stock market is such one business context where investors strive to have a favorable ROI in the face of various variables that may difficult to estimate their effect on invested money fully. Statistical concepts, for instance, are always put in play to model how each variable affects the S&P 500. This report explores factors that have the most impact on the S&P 500 using two regression models (Burch, Burch, Heller & Batchelor, 2015, p. 506).
Problem statement
The stock market is subject to various variables that determine its direction and general behavior. The variables are infinite, and it is essential that investors and financial analysts have real insights into how such variables affect it. The US stock market is influenced by both internal and external factors and in this respect, how do various variables affect the S&P 500. In particular, to what extent do the variables affect the S&P 500? When the variables are modeled, is the model reliable?
The rationale for the study
Investing in the stock market may lead to profit-making or even, result in disastrous results, that is, loss-making. It becomes essential that financial analysts and investors analyze how different factors impact on the stock market. In this regard, it is imperative that players in the stock market seek knowledge’s to foresee the behavior of the stock exchange and act accordingly. The rationale of this report is that it is one such source of knowledge that investors and financial analysts can rely upon to foresee the potential direction that the stock market is likely to take and as such, act from an informed perspective.
Research objectives
- What is the impact of various external and internal factors on the S&P 500?
- Which among the factors have a significant effect on the S & P 500?
As per the research objectives, the following hypotheses were formulated.
Hypothesis 1
- H1: All explanatory variables have equal impact on the S & P 500.
- H2: All explanatory variables do not have a similar effect on the “S & P 500”.
Statistical notation
- H1: µ1= µ2= µ3= µ4= µ5.
- H2: µ1≠ µ2≠ µ3≠ µ4≠ µ5.
Hypothesis 2
- H1: The model is adequate.
- H2: The model is not adequate.
Research design
A research design is an overall strategy used to integrate different components of the study in a coherent and logical way to adequately answer the research problem. An analytical research approach was used and based on secondary data. The data used was quantitative in nature where the hypotheses earlier formulated are to be proved by the statistical output. Since the data is secondary, it was obtained from various authentic sources such as “Statistical” and other government websites. The data was downloaded and input into SPSS where regression techniques were applied. Multivariate regression model and the results interpreted. The model was used as follows;
- yi =α + βxi + ei
Where
- Yi: is the dependent variable and represent the S&P 500;
- α: is the mean response;
- βxi: represents the change in the stock market given a change occurs in the explanatory variables;
- xi: are the independent variables.
Data analysis
The first model is as follows;
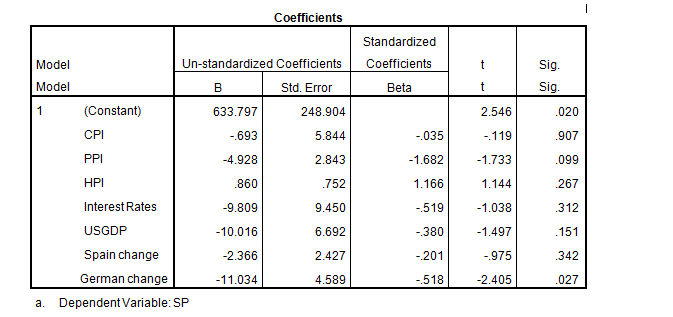
- S & P 500 = 633.797 – 0.693 CPI – 4.928 PPI + 0.869 HPI -9.809 IR -10.016US -2.366 Spain -11.034 Germany + e
The above model indicates that a unit increase in the CPI, PPI, Interest rates (IR), the rate of change in Spain and German will have a decrease of 0.693, 4.928, 9.809, 2.366 and 11.034 respectively in the S & P 500 while HPI as the positive impact of 0.869. 633.797 is the mean response (Ryan, & Ockert, 2015, p. 46).
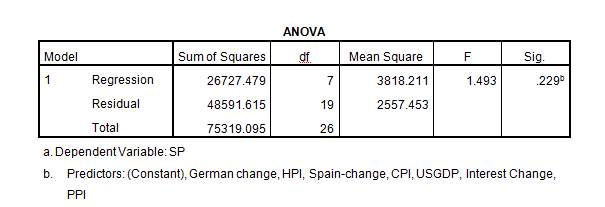
R2 = 35.5%, therefore, the model is not adequate. The second hypothesis sought to establish whether the above model was adequate. We reject H1 when p-value ≤ 0.05. So the model would be adequate if the sig. value < 0.05 but since it is not, we reject H1 and conclude that the model is not statistically significant. Therefore, the model is not reliable either regarding accuracy to explain the relationship between the variables and S & P 500. The second model R2 =25.6%, as such, the model is not adequate. The second hypothesis sought to establish whether the model was statistically significant as since 0.372 > 0.05 (α-level), as presented in Table 4 in the Appendix section, we accept the null and conclude that the model is not significant.
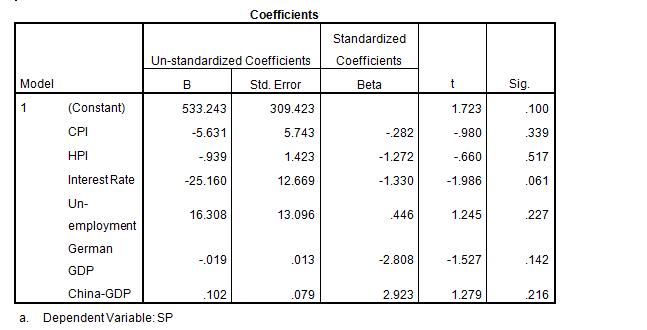
As shown in Table 4 in the Appendix, the empirical model is
- S & P 500 = 533.24 -5.631HPI – 0.939IR – 25.160 Unemployment + 16.308US – 0.019 Germany + 0.102 China + e
The 533.24 is the means response and a unit decrease in HPI, IR, Unemployment rate and the German and the GDP will create a decrease of 5.63, -0.939, -25.16 and -0.019 in the S & P 500. The US and the China GDP will have a positive impact on unit increases of 16,308 and 0.102 respectively.
Discussion
In the first model, a US GDP rate at a ‘beta’ score of 10.016 and “Percentage Change of Annual Average GDP of Germany (11.034) has the largest impact on S & P 500. The argument forwarded on the interplay between interest rates, and S & P 500 is that raising interest rates makes the market more uncertain thus; investors avoid investing more. It has been established that when interest rates rise, average annual returns stand at 6% but when they fall, S & P return only 6% (Rabiei, Taheri & Arghami, 2015).
In the second model, the rate of unemployment (16.308) and “Annual Average Interest Rate” (25.16) appears to have the largest positive impact on S & P 500. A ‘beta’ score of 16 and 25 explain for a unit increase of 16 and 25 in the dependent variable respectively. The German GDP, HPI, and Chinese GDP have the least impact at 0.939, 0.19 and 0.102 respectively. The “rate of unemployment” as conceptualized by Levine and Zervos (1998) claimed that stock market activity is related to economic growth. The two researchers relied on regression analysis and established that there is a positive correlation between stock market activity and economic and political factors, particularly in developing countries.
However, the position taken by Levine & Zervos (1998, p. 557) was contrasted by Corwin (2003, p. 234) who held that the factors that affect the stock market are asymmetrical and are dependent. Corwin held such factors were the economy; type of industry and among other micro and macroeconomics, such as the GDP of Germany as it has been evident in the two models, each variable placed in the model had an impact, thus justifying Corwin (2003) assertions. Chaturvedi and Shrivastava (2016) asserted that regression analysis could be used to determine the direction of the stock market that is, concerning its volatility.
According to him, a higher β indicates that the stock market is more volatile, while a lower β indicates the opposite. Contextually, the rate of unemployment had a score of 16.308 and “Annual Average Interest Rate”25.16 that are large scores and by Merle’s claims, it can be concluded that when employment and interest rates are high, the stock market becomes volatile and yields become are constrained (Corwin, 2003, p. 234). The four variables had the largest effect and analysts should track them to determine the direction of the stock exchange (Levine & Zervos, 1998, p. 543).
Limitation of this research
This study relied on a linear regression model which assumes that there is a direct association between the explanatory variable and the response variable. Therefore, it seeks to fit a line of best fit, which in most times is associated with a substantial error, thus limiting the accuracy of this analysis. Further, numerous variables affect S & P 500, thus, due to time and resources limitation, not all were captured in the model, and thus this study was also limited in scope (Johnson, 2010, p. 334).
Conclusion
The statistical analysis gives businesses a platform to make a decision from an informed perspective. One such business context is the US stock market where regression analysis was used to determine the impact of various variables on the S & P 500. It was established that the two models were not adequate as the R2 less than 75% (35.55 and 25%) and still, the models were not statistically significant. Further, the analyses established that “Percentage Change of Average Annual GDP of US” and “Percentage Change of Average Annual GDP of Germany” had an impact of 10 and 11 respectively. In the second model, “the rate of unemployment” had a score of 16.308 and “Annual Average Interest Rate” 25.16. The four variables had the largest effect and analysts should track them to determine the direction of the stock market.
References
Burch, G. F., Burch, J. J., Heller, N. A., & Batchelor, J. H. (2015). An Empirical Investigation of the Conception Focused Curriculum: The Importance of Introducing Undergraduate Business Statistics Students to the “Real World”. Decision Sciences. Journal Of Innovative Education, 13(3), 485-512. Web.
Chaturvedi, A., & Shrivastava, A. (2016). Bayesian analysis of a linear model involving structural changes in either regression parameters or disturbances precision. Communications In Statistics: Theory & Methods, 45(2), 307-320. Web.
Corwin, A. (2003). The Determinants of Underpricing for Seasoned Equity Offers. Journal of Finance, 58(5), 223-345. Web.
Johnson, J. (2010). Broadening the application of mixed methods in sales research. Journal Of Personal Selling & Sales Management. 35(4),334-345. Web.
Levine, R., and Zervos, S. (1998). Stock markets, banks, and economic growth. American Economic Review, 8(8), 537-558. Web.
Rabiei, M. R., Taheri, S. M., & Arghami, N. R. (2015). A Linear-Programming Approach to Interval-Valued Fuzzy Regression Analysis. International Journal Of Intelligent Technologies & Applied Statistics, 8(3), 171-203. Web.
Ryan, M. M., & Ockert, S. (2015). Business Statistics of the United States: Patterns of Economic Change. Lanham, MD: Bernan Press. Web.
Appendix


