Executive Summary
The main aim of this audit report is to asses the current waste management system to outline a new plan with follow-up actions. This report entails a combination of audit results and findings. It also provides an insight into the SP AusNet’s general performance of office compliance. It gives a cumulative summary of existing opportunities and cost-saving recommendations. Besides, the report outlines the protocols and procedures for conducting waste management audits such as visual inspection of the current waste boxes and disposal bins. In the report, notes and photos were taken for future reference. After conducting a high-level scope analysis and inspection on the 31st of January 2014, it is apparent that the waste management industry can improve its environmental performance and compliance by undertaking several actions such as:
- Encouraging employees to dispose of wastes appropriately.
- Ensuring that wastes from offices are stockpiled and disposed of in an environmentally-friendly manner.
- Avoiding extra costs by separating recyclable wastes and putting them in different waste bins.
- Encouraging re-use by recycling more wastes and using fewer raw materials.
- Seeking and promoting initiatives so that decimate the use of raw materials.
Background
Previously, there was a lack of data on waste composition. Therefore, the waste audit exercise was carried out to identify, classify and examine the composition of wastes emitted within the SP AusNet’s offices. The analysis was done on individual waste streams and those generated from collective functional zones within the organisation. The latter was also meant to ensure compliance with the requirements set by EPA’s regulations.
The audit report was meant to determine the generators’ ability to reduce, avoid and recycle materials from the waste streams. Additionally, the audit report aimed to support the need to strengthen recycling plans and provide a guideline for a waste reduction program. Also, the waste audit entails measuring the quantity of waste production, identifying composition, and how wastes are produced. The waste audit focused on management policies and decisions related to waste production.
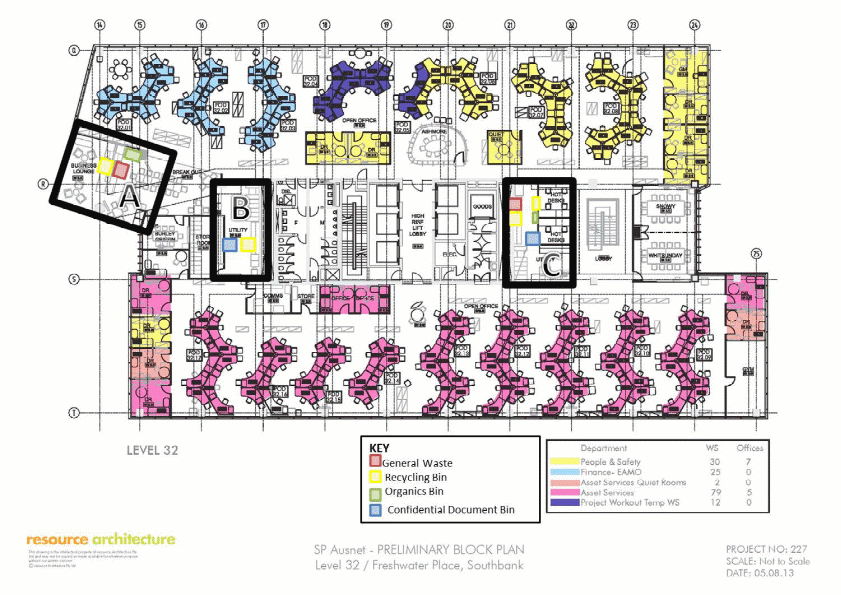
SP AusNet possesses and manages Victoria’s power transmission network besides owning electricity gas and supply networks. Approximately, there are 1800 members of staff out of which 300 operate within the city offices. SP AusNet’s offices are situated in Freshwater Place Southbank. It is worth to mention that the edifice has a total of 36 levels. SP AusNet’s employees occupy four of them.
Methodology
The waste audit exercise was carried out on the 31st of January 2014. The assessment of site comprised of three individualised visual inspections. The first inspection was conducted at 9:30 am when all the employees had already begun working. This time was deliberately selected to see the amount of garbage brought into the site from numerous cafes and restaurants in the surrounding areas. The second visual inspection took place at exactly 2:30 pm since lunchtime begins from 12 pm to 2 pm. The third and final inspection was carried out at 5:30 pm because most of the workers had finished their tasks and left the site. The high-level scope analysis carried out revealed that the wastes were not sorted manually.
- Printer Area No. 1
- Kitchen and Lunchroom
- Printer Area No. 2
9:30 am: Visual Inspection
During the first visual inspection, the initial analysis was done on the employees’ operating area. In the site, there were desks and small cardboards and VISY paper recycling bin. Upon careful analysis, one could see stains of food in the paper recycling bins. This indicated that employees used the paper recycle bin as food scrap and coffee cups bin. This could be attributed to the fact that they were to leave their station and walk to the nearest general organic bin where they could dispose of food scraps and wrappers. However, the only general organic bin was located at the kitchen and Printing Area 1.
2:30 pm: Visual Inspection
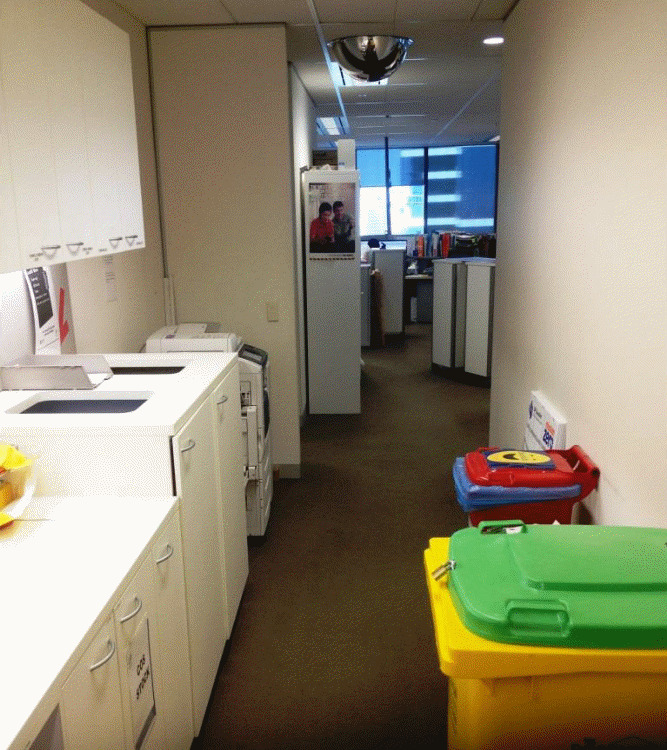
The second visual inspection was conducted on Printer Area 1. This area is indeed spacious even though there are numerous bins which confuse staff members. As illustrated in Figure 2 below, there is a white cabinet that is just adjacent to the printer. The cabinet has two cutouts at the top that are used as waste chutes. There is a general waste chute which has a black polythene bag whereas the recycling bin is just plain without a bag. The waste is thrown directly into the plain recycle bin. There is a paper tray between the two chutes.
During the inspection, the recycling chute was full of the paper ream and shredded papers (See figure 2.1 below). This indicated that the bin had not been emptied for a long time.

There is a 60L green organics bin with signage stating “ORGANIC WASTE ONLY”. After careful observation, one could note that majority of the staff members are aware of what an organic waste means because most of the contents in the bin are banana peels and food scraps. The bin has a bag that is clear in colour, thereby making it easier for the cleaner to identify the content from other wastes. Alongside the 60L bin, there is a 120L recycling bin that is red. Its lid has a “thank you” sign and a struck sign at the bottom. There is an illustration of acceptable items that include aluminium, plastic, glass and bottles attached at the bottom. Due to the position of the bin, it is very hard to read or even notice the signage (See the figure below).

It is important to note that there is a 60L box for ink cartridges in Printer Areas 1 and 2. There is also an appointed staff member whose role is to change the ink cartridges. Furthermore, there are DOC Shops, secure document bin, a 120L VISY bin and cardboard box for recycling papers in Printer Area 2.
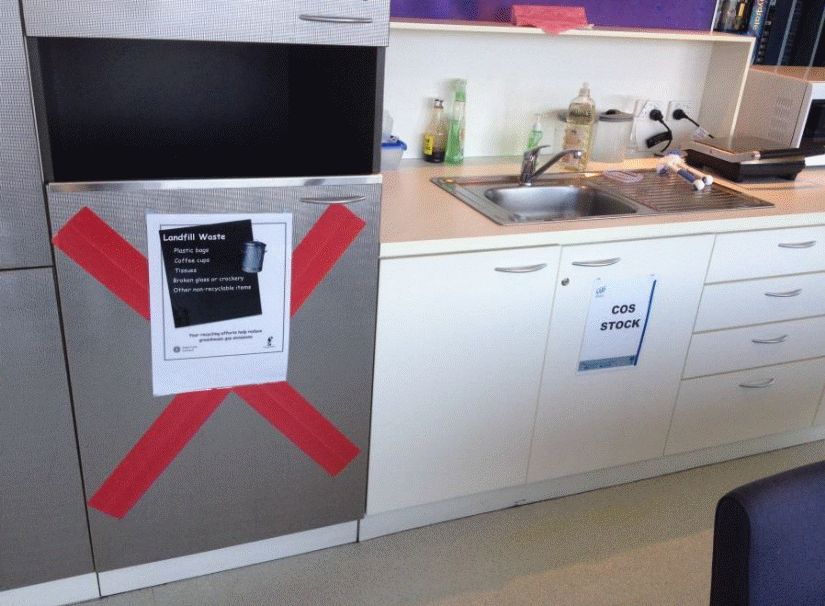
The lunchroom and kitchen areas on level 32 have a 60L green organics bin. The bin is hidden in one of the corners between the wall and the fridge. Moreover, there is no signage above or around this bin. Therefore, it completely relies on employees’ knowledge to understand and dispose of acceptable wastes. The recycle bin in the kitchen is a chute which is also part of the cupboard. The signage in the bin is visible and very detailed, as shown below.
During this visual inspection, the staff members had taken their lunch and went back at their work stations. When taking photographs through the area, it was found out that the recycling bins at the desks had a minimal litter. There were several litter bins with tissue papers, plastic boxes and food scraps. In Printing Area 1, the volume of wastes in general and recycling bins increased.
5:30pm: Visual Inspection
At this time, most staff members had gone home and therefore. It was easier to do the waste audit. In the desk, recycling bin, papers and post notes were the most common type of litter. More paper and paper reams were being recycled in Printer Area 1 whereas there was no increase of wastes in Printer Area 2.
Key Findings
Existing waste systems
The following is a summary of the current litter/recycling systems used at SP AusNet’s offices.
Printer Area 1 Waste Stream System
Printer Area 2
Kitchen and Lunchroom Area
Desks
Data based on historical records
Waste Profile
The following provides the data from the 24 hour waste assessment per stream
Printer Area 1


Kitchen and Lunchroom
Discussion
Preliminary site visit
All the sites were available for visual inspection as planned. The assessment was done on the bins and photographs also taken to facilitate high-scope analysis. It was found out that the latest waste audit was done way back in 2008. Hence, the present management plan was outdated. There were no costs or invoice for waste disposal records.
Site Analysis
There were too many bins in Print Area 1 of level 32. The bins were also too close to each other. Therefore, they needed to be redesigned to ensure that they had visible signage and different colours. Bins in Print Area 2 required visible signage. There was a need to reposition the bins in the Kitchen and Lunchroom to minimise contamination levels.
Individual recycling streams
Employees need to be made aware of acceptable materials to be disposed of in various waste bins to avoid excessive contamination. Moreover, employees should be keen to check the signage to understand what should be disposed of in organic bins.
Specific Issues
Establishing a centralised approach will help in reducing contamination and minimise recycling costs. Bins should be positioned in a manner that is convenient for use by employees. Moreover, they should be emptied regularly to avoid overflow and spread of unwanted papers around the printer or on the floor. Some signage, especially at the kitchen, should be made clear and visible.
Cost Saving
Communication and awareness will help employees to avoid wastage of time while dealing with confidential documents. Employees should also make use of storerooms to store waste materials and reduce frequent waste collection. Putting clear and correct signage will reduce contamination and the expenses of waste disposal.
Photographs


Opportunities
Some of the opportunities to improve the management of waste products include:
- Avoiding waste of papers by embracing double-sided printing.
- Reducing unnecessary printing.
- Use of energy-efficient equipment to reduce energy costs.
- Specifying equipment before buying to minimise overspending.
- Undertaking regular service and repairing of equipment to reduce the cost of buying new ones.
- Embracing the e-waste management program.
Recommendations
- Put posters to inform staff members about acceptable and unacceptable trash
- Update and make signage clear and visible in all the bins.
- Send memos and emails emphasising the importance of recycling waste papers.
- Implement staff’s awareness day on waste management.
- Use different coloured bins to avoid waste contamination.