SPSS Assignment
Exploratory Data Analysis


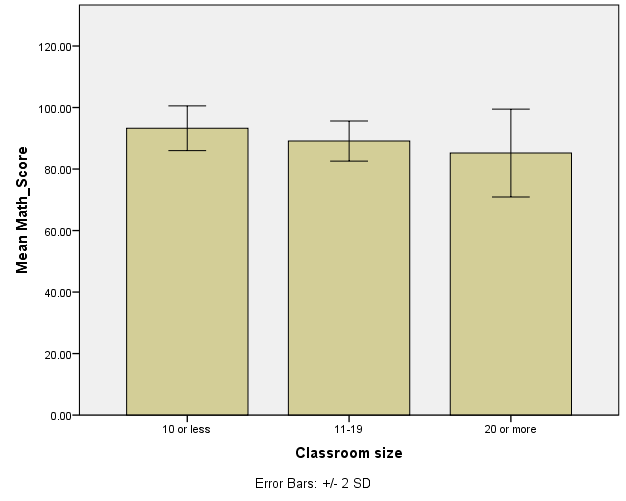
The mean math score for the small classroom was 93.25 with a standard deviation (SD) of 3.64 and a standard error of 0.81. The mean math score for the medium classroom was 89.10 with a standard deviation of 3.26 and a standard error of 0.73. On the other hand, the mean math score for the large classroom was 85.20 with a standard deviation of 7.15 and a standard error of 1.59. The bar graph showed that the large classroom had the lowest math score.
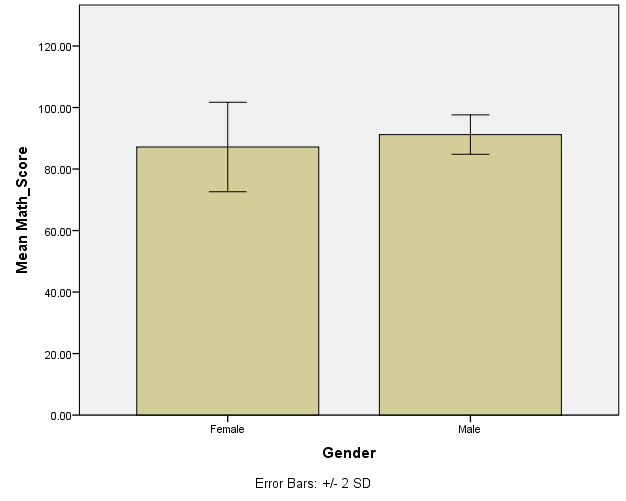
The mean math score for females was 87.17 with a standard deviation of 7.27 and a standard error of 1.33. Conversely, the mean math score for males was 91.20 with a standard deviation of 3.19 and a standard error of 0.0.58. The bar graph showed that male scores were higher than female scores.
Factorial ANOVA
There is a significant main effect of gender F(1, 54) = 19.056, p < 0.05. Post hoc tests were not required in this case because there were fewer than three groups.
There is a main effect of classroom size F(2, 54) = 25.311, p < 0.05, indicating a significant difference between small classroom (M = 93.25, SD = 3.64), medium classroom (M = 89.10, SD = 3.26), and large classroom (M = 81.20, SD = 7.14). The Least Significant Difference (LSD) post hoc test showed that the difference between small and medium classroom was significant (p = 0.001). Similarly, significant differences were observed between small and large classroom (p <0.05) as well as between medium and large classroom (p = 0.001).
There is an interaction between the two variables as shown by the SNK post hoc test. The large classroom (20 or more) is significantly different from the medium classroom (11 to 19), which is also significantly different from the small classroom (10 or less).
There is support for the researcher’s hypothesis regarding girls’ better performance in classrooms with fewer students. In the interaction means between classroom size and gender, females in small classrooms have a higher math score of 93.8 (SE=1.132) compared to males with a mean of 92.7 (SE=1.132).
A factorial ANOVA is a statistical analysis that is done to compare the means of two or more independent variables, which break up the sample into a minimum of four categories (Fox, 2015). A factorial ANOVA was conducted to compare the main effects of classroom size and gender and the interaction effect between classroom size and gender on math scores. Classroom sizes included small (10 or less), medium (11 to 19), and large (20 or more), whereas gender consisted of two categories (male and female). A total of 20 math scores for students in each category were compared. All effects were statistically significant at the 0.05 significance level. The main effect for classroom size generated an F ratio of F(2, 54) = 25.311, p < 0.05, indicating a significant difference between small classroom (M = 93.25, SD = 3.64), medium classroom (M = 89.10, SD = 3.26) and large classroom (M = 81.20, SD = 7.14).
The impact of classroom size had a moderate effect of 48.4%. The main effect for gender yielded an F ratio of F(1, 54) = 19.056, p < 0.05, indicating that the effect for gender was significant, male (M = 91.20, SD = 3.19) and female (M = 87.17, SD = 7.27). The main impact of gender had a small effect of 26.1%. The interaction effect was significant, F(2, 54) = 19.102, p < 0.05 with a moderate effect of 41.4%. These findings showed that classroom size has an effect on the math scores of elementary-age children. Smaller classrooms are associated with higher math scores than large classrooms. In addition, female students are likely to perform better than their male counterparts in small classrooms. Therefore, classroom size and gender have a significant influence on the math scores of elementary-age children.
Applying Analytical Strategies to an Area of Research Interest
The research area of interest is to determine the effect of color on emotions.
The independent variable is color. On the other hand, two dependent variables are emotions and memory.
Mock ANCOVA Output Table
Analysis of covariance (ANCOVA) is a statistical analysis method that compares the means of two or more independent categories on a given dependent variable (Brace, Snelgar, & Kemp, 2016). One of the independent variables is considered a covariate or confounding factor that could influence the dependent variable. ANCOVA was done to compare the effect of color on emotion while adjusting for memory. There was a significant difference in the range of emotions [F(2, 56) = 15.372, p < 0.001] elicited by different colors whilst adjusting for memory. The impact of color on memory had a small effect of 17.1%, whereas the effect of color on emotions had a small to medium effect of 35.4%.
References
Brace, N., Snelgar, R., & Kemp, R. (2016). SPSS for psychologists: And everybody else (6th ed.). New York, NY: Palgrave Macmillan.
Fox, J. (2015). Applied regression analysis and generalized linear models (3rd ed.). Thousand Oaks, CA: Sage Publications.