Statistics
Exploratory Data Analysis

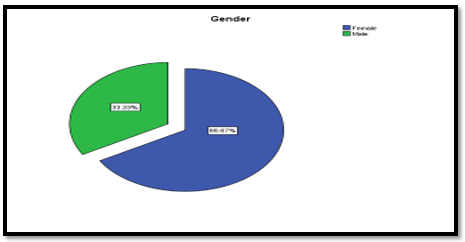
Pie chart (Figure 1) depicts that the proportion of males (33.33%) is less than that of females (66.67%). Descriptive statistics (Table 1) indicate that the test scores increase with the duration of learning. The means of test scores increased from the baseline of 29.58 (SD = 12.22) in the first week to 33.08 (SD = 10.11), 35.42 (SD = 9.89), 35.67 (SD = 10.67), 39.92 (SD = 9.72), 45.67 (SD = 8.69), and 50.00 (SD = 10.19) in 2, 4, 6, 8, 10, and 12 weeks, respectively. Therefore, descriptive statistics demonstrate that the duration of learning improves the performance of students.
Repeated Measures ANOVA
Table 2 shows that time and gender vary with test scores among participants. The means of test scores not increase with time but also those of males are greater than those of females.
The analysis of data (Table 3) shows that it violates the assumption of sphericity because it rejects the hypothesis that variances of test scores are equal, χ2(20) = 56.876, p = 0.000. The violation of the assumption of sphericity inflates F-ratio and increases the probability of type I error (Field, 2018). In instances where there is a violation of the assumption of sphericity, interpretation of results requires the use of Greenhouse-Geisser correction.
Repeated measures ANOVA based on Greenhouse-Geisser correction (Table 4) shows that gender has no main effect on the test scores of participants due to the lack of statistically significant interaction effect. Post hoc analysis is not possible in this case because gender is a variable with two categories. Time has a statistically significant main effect because it increases with test scores, F(2.646, 26.456) = 20.609, p = 000. Post hoc tests are not applicable here because test scores is a within-subject variable. Overall, time and gender has no statistically significant interaction in influencing variation in test scores, F(2.646, 26.456) = 1.156, p = 0.341.
Application of Analytical Strategy
My research area of interest is the influence of the duration of advertising on the purchasing behavior of customers. The duration of advertising, persuasiveness, and gender are three variables that I would employ in repeated measures ANOVA. The duration of advertising is an independent variable that exists on a continuous scale of the number of days. In contrast, persuasiveness is a dependent variable measured on an ordinal scale based on a 10-point Likert scale. As a demographic variable, gender is on a categorical scale comprising males and females. Persuasiveness is a repeated measure assessed daily for one week as per the duration of advertising, whereas gender is a fixed factor.
In SPSS output, I would look at the table of Mauchly’s test of sphericity to determine if the variance of persuasiveness violated the assumption of sphericity. Specifically, chi-square value and p-value would determine if variation in persuasiveness in different days of advertising is equal. If the data do not violate the assumption of sphericity, it implies that F-ratio is accurate and the probability of type I error is low.
Reference
Field, A. (2018). Discovering statistics using IBM SPSS statistics (5th ed.). New York, NY: SAGE Publications.